Debugging
Vonage Cloud Runtime allows you to debug your code locally as if it was deployed on the platform. It works by starting a remote debug server that proxies requests to your local version. You can use your IDE to attach a debugger, set breakpoints and run through the execution of your project line by line.
Debugger Dependencies
You will need to install a file watcher, for example, nodemon globally:
Start a Debug Session using the Terminal
Edit your configuration file (vcr.yml) to add an entrypoint for debug under a root level debug:
project:
    name: project
instance:
    ...
debug:
    name: debugger
    entrypoint: [nodemon, --inspect, index.js]
Next, open a terminal session in your project directory and run the debug start command:
This will start the server, so once it is done you can start using your application. The debugger will show any incoming and outgoing requests. Code changes you make and save will trigger the debugger to reload automatically.
Injected Environment Variables
When you run your project using vcr debug (or deploy your project to Cloud Runtime), the platform will inject some environment variables for you along with the environment object from your configuration file.
VCR_PORT
VCR_REGION
VCR_DEBUG
VCR_CODE_DIR
VCR_REGION_ID
VCR_PRIVATE_KEY
VCR_API_REGION_ID
VCR_API_ACCOUNT_ID
VCR_API_ACCOUNT_SECRET
VCR_API_APPLICATION_ID
VCR_INSTANCE_PUBLIC_URL
VCR_INSTANCE_SERVICE_NAME
Debug from VSCode
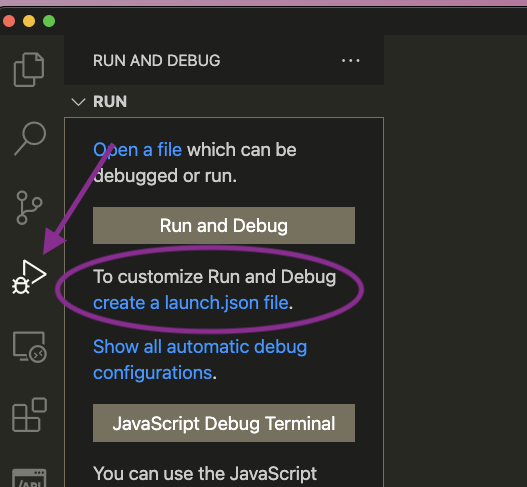
Using VSCode you can attach a debugger to the server to allow you to set breakpoints and step through your code. To do so click on the Run and Debug button, then create a launch.json file. Select nodejs as a preset:
In the launch.json file replace the entire contents of the file with the following:
{
    "version": "0.2.0",
    "configurations": [
        {
            "command": "npm run debug",
            "name": "Start Debugger",
            "request": "launch",
            "type": "node-terminal"
        }
    ]
}
This will start your application using the npm run debug command and attach the VSCode debugger. Your npm run debug command should run vcr debug.
Click on the start debugging button:
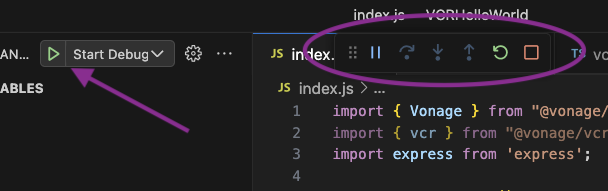
Once your application is running and the debugger is attached you will have access to the debug controls.
Breakpoints
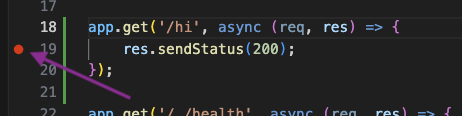
By clicking to the left of a line number you can set a breakpoint in your code, so the program will pause on this line and allow you to inspect the program, step over and so on:
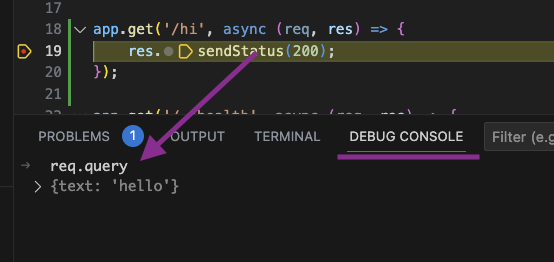
When your breakpoint is hit, VSCode will highlight the line that it has stopped on, and using the debug console you can print out values from your program:
Alternatively, you can use the debug controls to inspect your code even deeper by stepping in and out of functions or continuing past the current line.
Clearing Debug Session Data
When running vcr debug, session data is persisted between restarts by default (controlled by the preserve-data field in vcr.yml). To clear all session data stored during a debug session, run:
This removes all session state associated with your debug instance. It is useful when you want to test your application from a clean state without redeploying.