
Share:
Zining is a former Product Manager at Vonage focused on developer tooling
Getting Started with Advanced Insights
Time to read: 7 minutes
So you want to get more insights into how your video application’s performing. Maybe you want to track your video application’s usage to see how many minutes your users are spending per session. Or perhaps you’re looking to analyze quality information to understand your customer’s video experience better. You’ve heard about Advanced Insights, but you’re not sure where to start? Well, you’re in the right place!
Don't have Advanced Insights yet? Contact us and we'll get you started!
We’ll show you how to quickly get started querying your video session information using Advanced Insights and GraphQL. For our tutorial, we’ll be using the Inspector Tool as an example and go through how you could get the data you need to build your own custom Inspector-like dashboard.
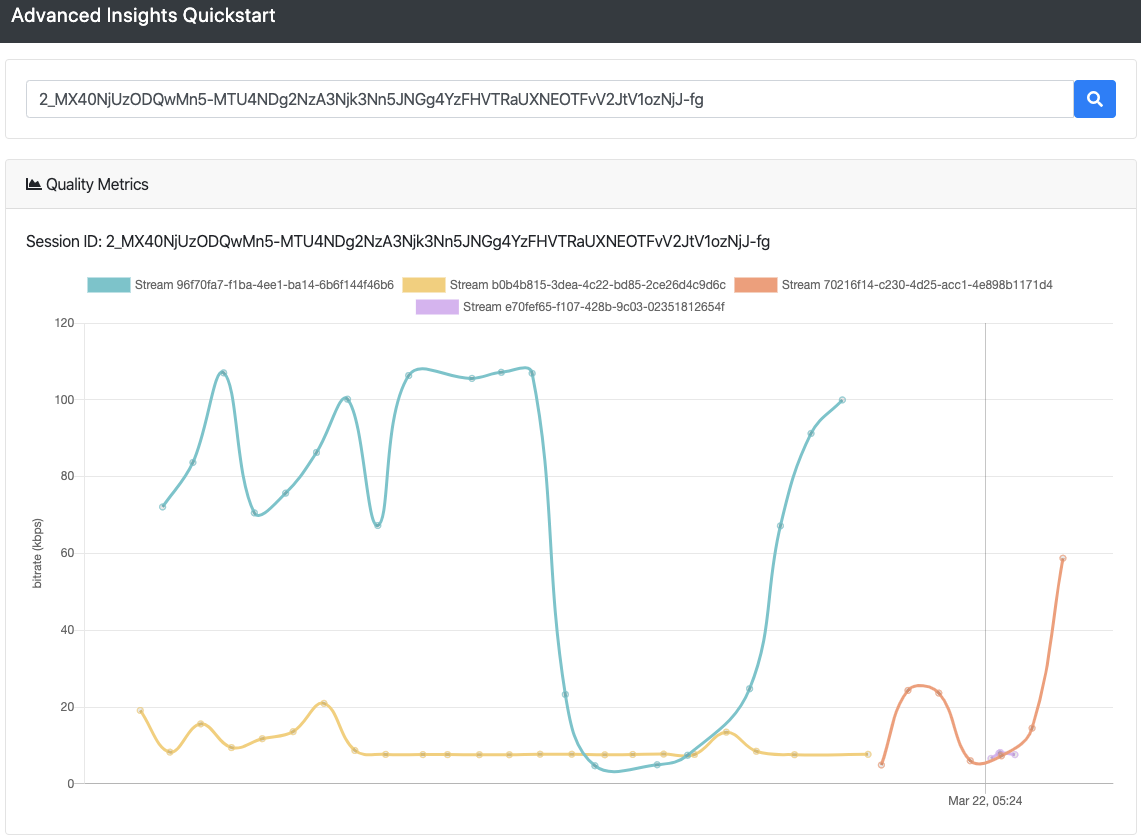
For the purposes of this guide, we will mostly focus on getting publisher bitrate data to build a quality chart for a specific session similar to the Quality Metrics or Publisher Details component in the Video API diagnostics tool, Inspector.

By the end of this tutorial, you will know how to make Advanced Insights queries to get all the data you need to build a publisher bitrate chart on a custom dashboard.
Want to skip to the end? You can find all the source code for this tutorial on GitHub
This tutorial assumes that you are a Video API user with an account that has useage data. If you don’t have an account already or haven’t started building with the Vonage Video API yet, follow these quick and easy tutorials to get started!
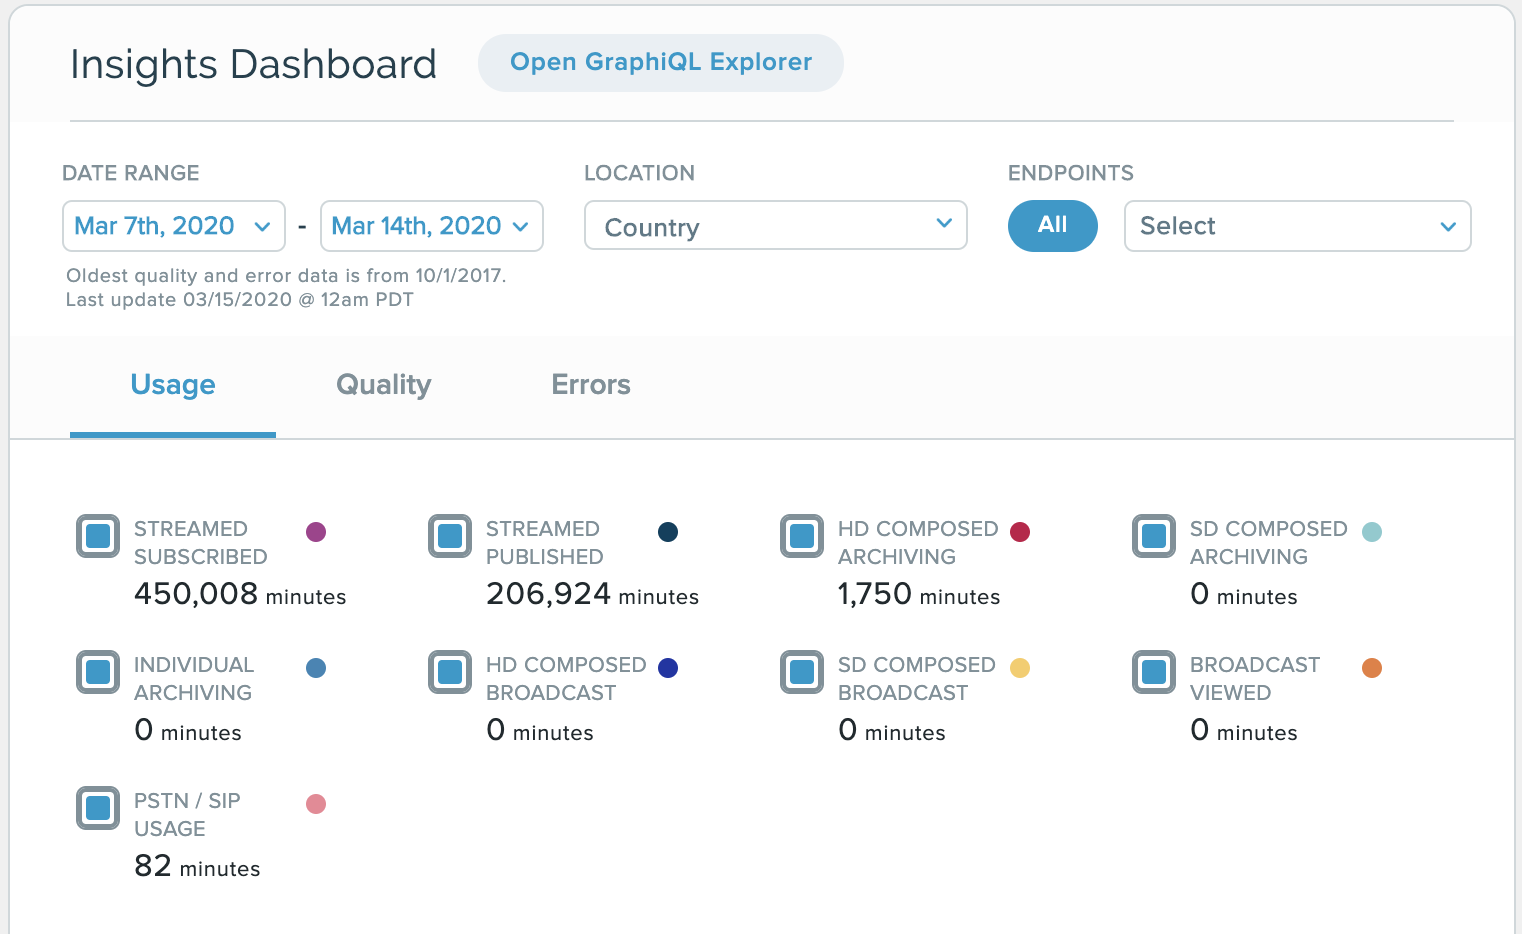
Advanced Insights relies on GraphQL for making queries to access your Vonage Video API data. Don’t worry if you’re not familiar with GraphQL, it’s super easy to get started! We even have a handy development environment available to test out your Advanced Insights GraphQL queries called the Insights GraphiQL Explorer (notice the "i" in GraphiQL). This can be accessed straight from your Insights Dashboard.
Before accessing your video data with Advanced Insights, we first need to understand a little bit about how GraphQL works.
In general, when you make a GraphQL query, it will be validated against a GraphQL schema and receive a JSON-like response. In our case, it will be validated against our Advanced Insights schema.
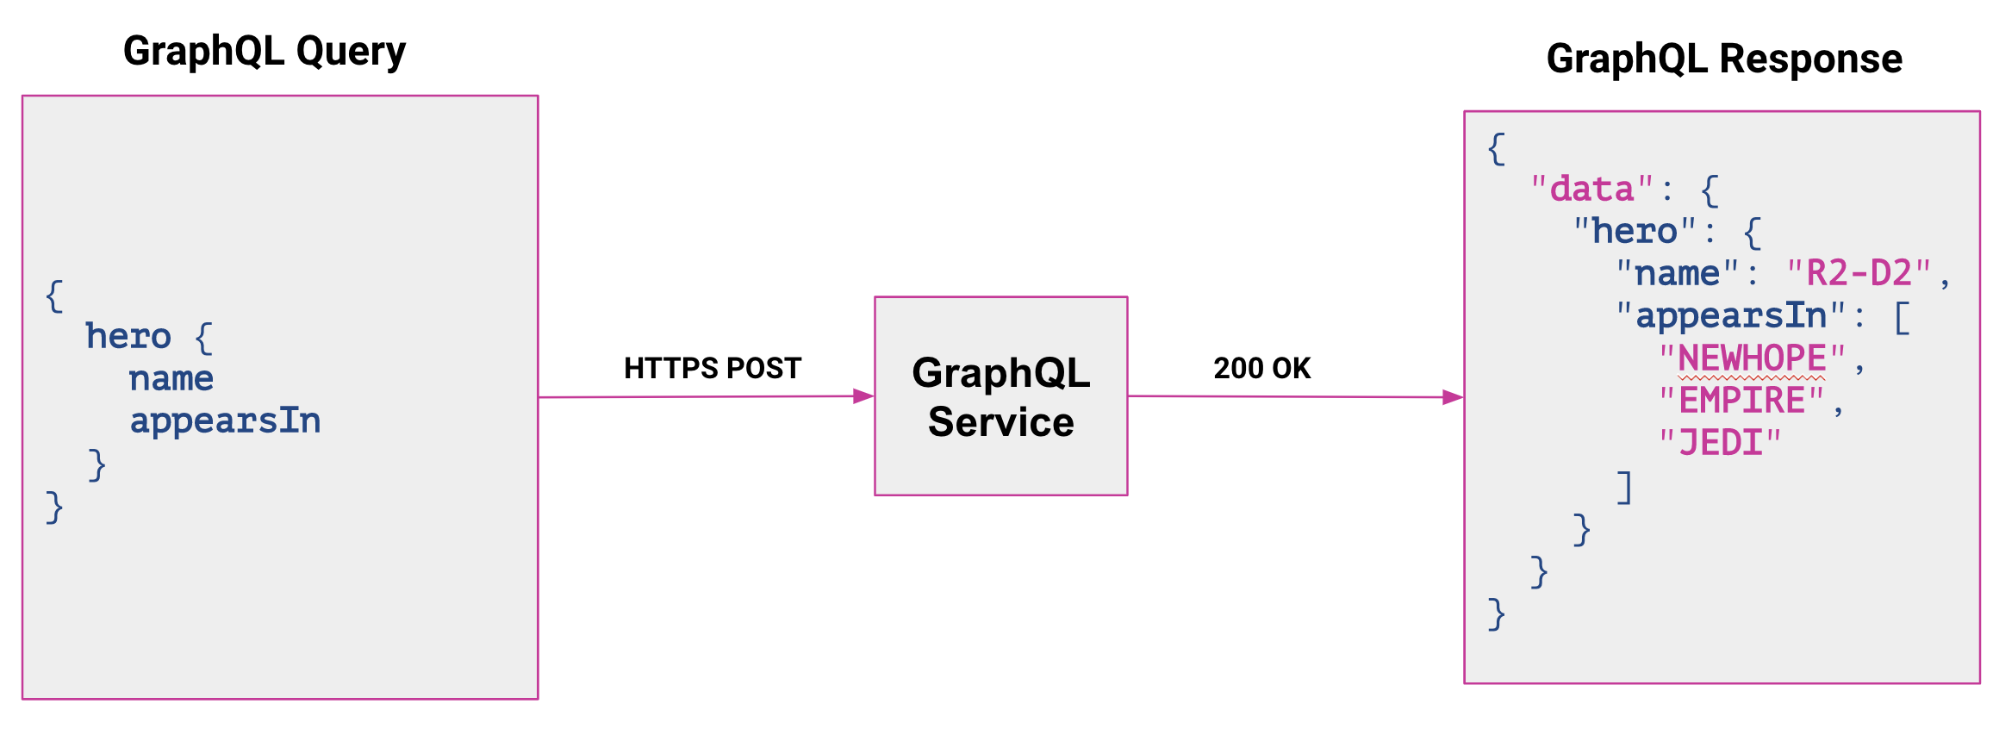
A schema is a set of graphQL object types that describes what data you can query for on the API. Documentation on our Insights schema can be found on the right side of the Insights GraphiQL Explorer.
A GraphQL object is defined by a type and the associated fields on the type.
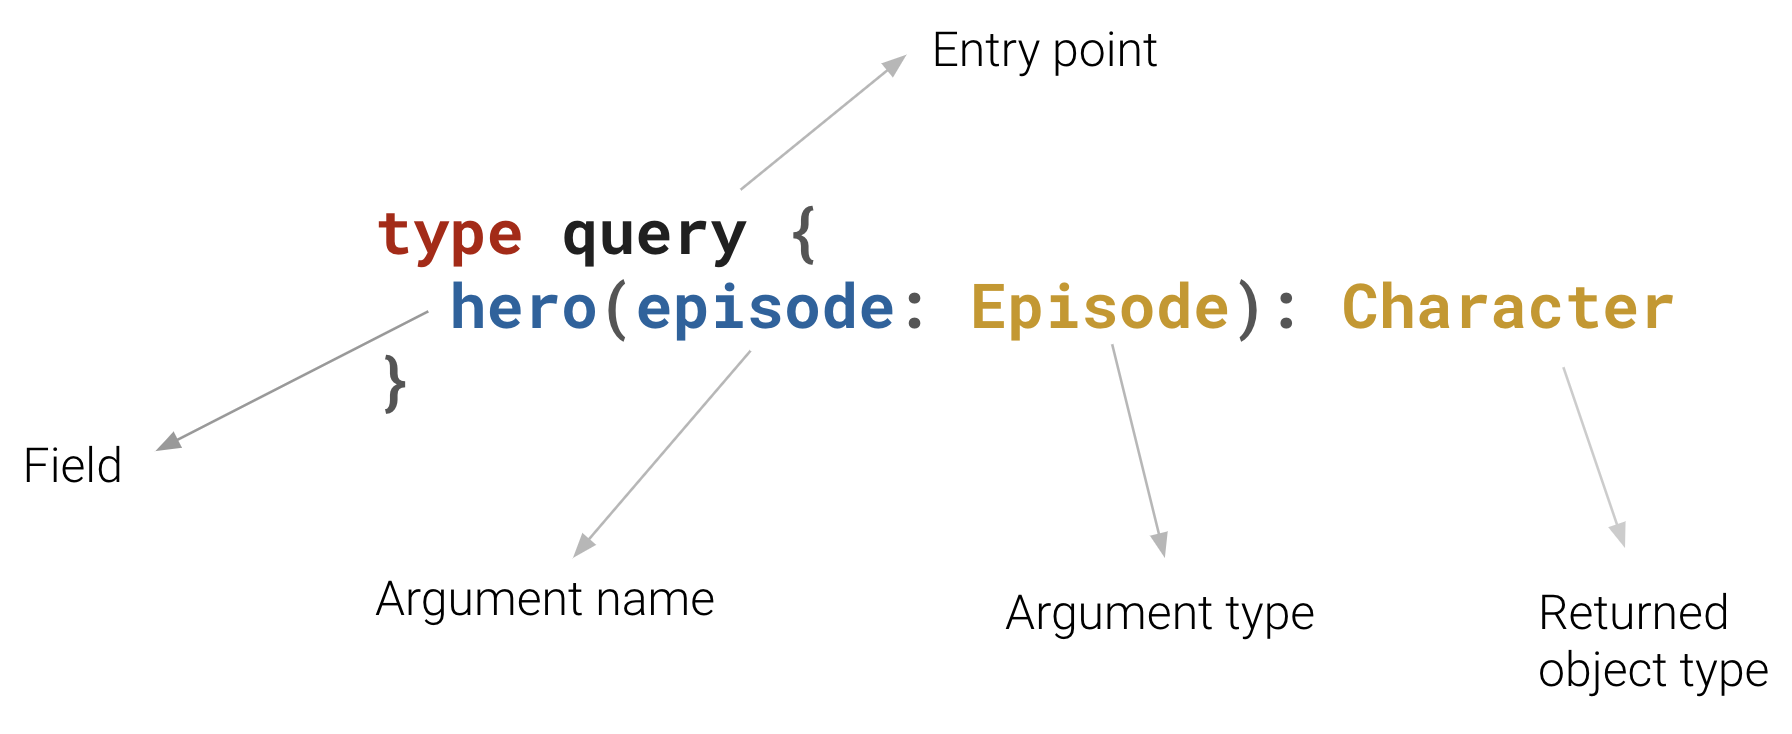
Let’s say you want to know the name of a certain hero with the following GraphQL schema (from Introduction to GraphQL).
type Query {
	  me: User
}type User {
id: ID
name: String
}This hypothetical query:
{
      me {
        name
      }
}would produce the following JSON:
{
      “me”: {
        “name”: “Luke Skywalker”
      }
    }
Now let’s access some of your video data using Advanced Insights and GraphQL. For our first query, our goal is to get a list of session IDs.
First, let’s specify our project id, which would be your project’s API key.
{
      project(projectId: Your API Key Here) {
        ...
      }
}Now since we’re looking for our session IDs, we need to use sessionData.
{
      project(projectId: Your API Key Here) {
    	sessionData{
          ...
    	}
      }
}If we would like to see our options within sessionData, we can use our trusty Schema Explorer within our Insights GraphiQL Explorer. Searching for sessionData gives us the following results:
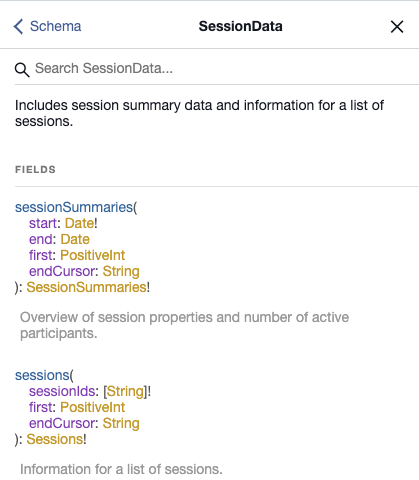
This tells us that within sessionData, we should specify a sessionSummaries field which requires at least a start argument as denoted by the ! at the end of the start type.
Let’s specify a start date in our query.
Note: Advanced Insights has a data retention period of 21 days. You will receive an error if a date older than the retention period is specified. A full list of errors can be found here.
{
      project(projectId: Your API Key Here){
        sessionData{
          sessionSummaries(start: Your timestamp here){
            ...
          }
        }
      }
}Since we want a list of sessions ids, we’d want to specify that in the resources within sessionSummaries. To view available resources from the Schema, navigate to the sessionData Schema page (simply search for sessionData), select the type SessionSummaries! (type is in yellow), then select [SessionSummary]! type under “Fields”.
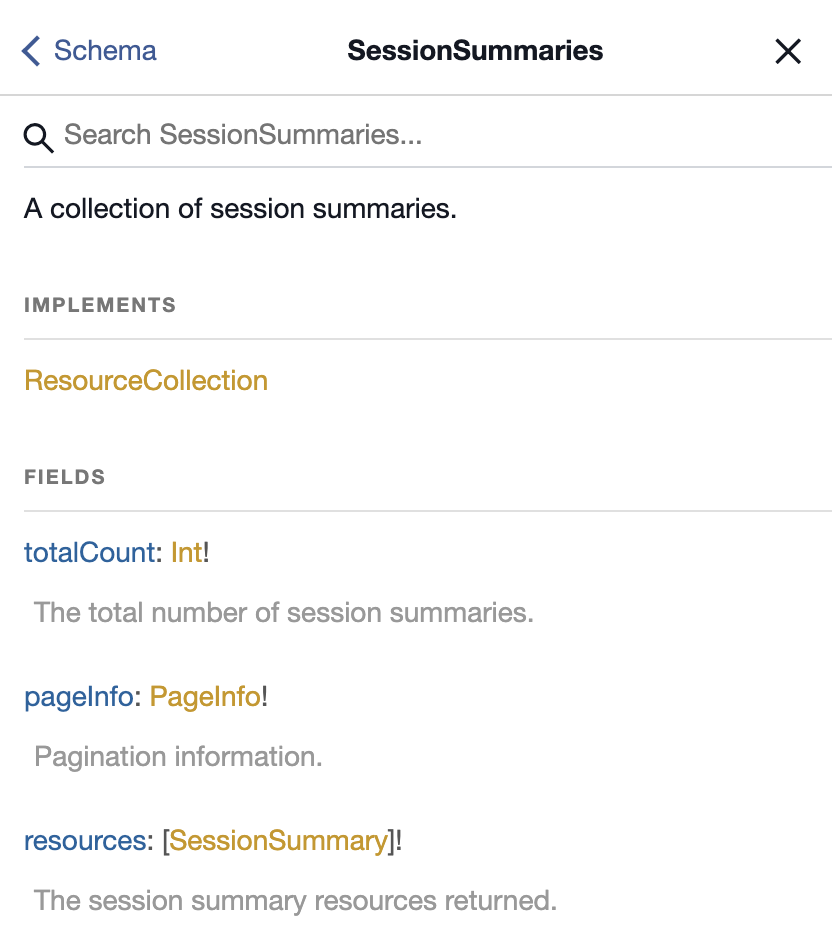
Note: The square brackets around
SessionSummarysignifies that this will return a list
{
      project(projectId: Your API Key Here){
        sessionData{
          sessionSummaries(start: Your timestamp here){
            resources{
              sessionId
            }
          }
        }
      }
}You now have a complete query. Copy and paste this into your Insights GraphiQL Explorer (Make sure you’re logged in to your account). Remember to fill in the projectID field with your API key and specify a start time!
Once you run this query, you should get back something like this.
{
	  "data": {
		"project": {
		  "sessionData": {
			"sessionSummaries": {
			  "resources": [
				{
				  "sessionId": "Your Session ID Here"
				},
				{
				  "sessionId": "Your Session ID Here"
				}
			  ]
			}
		  }
		}
	  }
}As shown in the results, we should get a list of our session IDs in JSON format.
From the schema, we can see that mediaMode is another field that’s available under SessionSummary. Adding this to our query:
{
      project(projectId: Your API Key Here){
        sessionData{
          sessionSummaries(start: Your timestamp here){
            resources{
              sessionId,
              mediaMode
            }
          }
        }
      }
}Returns:
{
	  "data": {
		"project": {
		  "sessionData": {
			"sessionSummaries": {
			  "resources": [
				{
				  "sessionId": "Your Session ID Here",
				  “mediaMode”: “routed”
				},
				{
				  "sessionId": "Your Session ID Here",
				  “mediaMode”: “routed”
				}
			  ]
			}
		  }
		}
	  }
}By simply adding one more field to our query, we were able to learn if a session was routed or relayed providing you with an additional layer of information.
Now that you know how to make a simple GraphQL query and access your video project data, let’s start building our query for accessing your video bitrate information.
First, we need to figure out what data we need to build a publisher bitrate chart. Let’s first take a look at the chart in our Inspector tool.
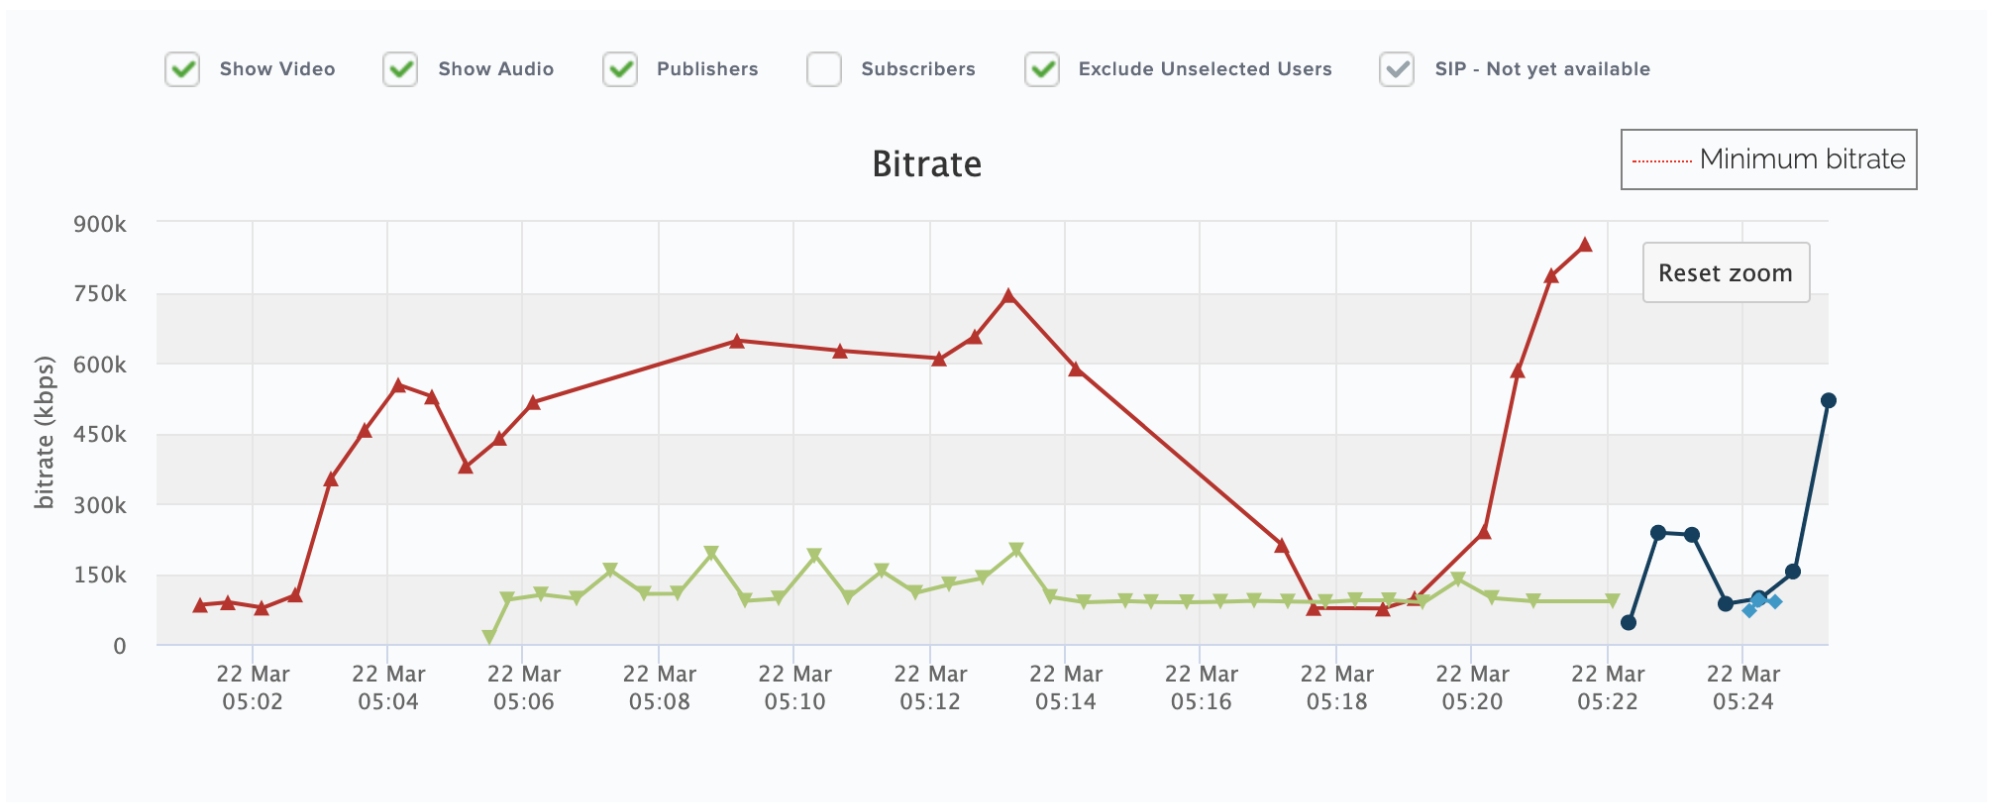
To access this chart in Inspector, we had to first enter the ID of the session we’re interested in. This means we would definitely need to have the Session ID in our query. We are also looking for publisher bitrate so we probably want to specify that as well. The quality is separated by individual streams (each line color on the Inspector chart represents a different stream), so we would need to have a way to separate the bitrate by stream. Lastly, but most importantly, we know that we would need to access some form of bitrate data. In Advanced Insights, bitrate information is stored under Stream Statistics.
We now have a general idea of which fields we need. Knowing this, let’s start building our GraphQL query!
Right off the bat, we need to specify our project Id (AKA API key). We will again use sessionData because we’re querying session-level data. Since we know the session that we’re interested in, we can use the sessions field. From the schema, we know that this field requires an array of session IDs. We’re only interested in a single session so we can just enter a single session ID (If you enter more than one session IDs, the query will return the specified data for all of the sessions that were entered).
Our query should look like this:
{
      project(projectId: Your API Key Here){
        sessionData{
          sessions(sessionIds: ["Your Session ID Here"]){
            ...
          }
        }
      }
}In Advanced Insights, our streams are grouped by meetings. This means that to get to our stream data, we would need to specify meetings in our query. Looking at the resources available for sessions in the schema (you need to click on the yellow Session type), we can see meetings as an available field. Digging deeper into the resources for meetings, we see that publishers is a field under meetings. Perfect! We’re looking for publisher data, so let’s include publishers in our query as well.
{
      project(projectId: Your API Key Here){
        sessionData{
          sessions(sessionIds: ["Your Session ID Here"]){
            resources{
              meetings{
	            resources{
                  publishers{
                    ...
                  }
                }
              }
            }
          }
        }
      }
}We know we’re trying to get to stream-level information, so let’s explore the publishers field. From the schema (seeing a pattern here?), we can see that publishers has a field called streamStatsCollection. Does that sound familiar? That’s right! Our video bitrate data is saved under Stream Statistics! Looking into the resources under the type PublisherStreamStatsCollection, we get a lot of different quality-related fields that we can access for our video stream. For the purposes of this guide, we’re only interested in our video bitrate so let’s add the field videoBitrateKbps to our query. To build a bitrate chart, we would also need to have a time associated with our bitrate reading. So let’s add the createdAt field while we’re at it.
The query should now look like this:
{
      project(projectId: Your API Key Here){
        sessionData{
          sessions(sessionIds: ["Your Session ID Here"]){
            resources{
              meetings{
    			resources{
                  publishers{
                    resources{
                      streamStatsCollection{
                        resources{
                          videoBitrateKbps,
                          createdAt
                        }
                      }
                    }
                  }
                }
              }
            }
          }
        }
      }
}This query is enough to get us our publisher video bitrate per stream. To make it more clear, we would probably want to attach a name to our stream quality. To do this, we go back to the resources available for streamStatsCollection and add streamID which is under stream.
{
      project(projectId: Your API Key Here){
        sessionData{
          sessions(sessionIds: ["Your Session ID Here"]){
            resources{
              meetings{
    			resources{
                  publishers{
                    resources{
                      stream{
	                    streamId
                      }
                      streamStatsCollection{
                        resources{
                          videoBitrateKbps,
                          createdAt
                        }
                      }
                    }
                  }
                }
              }
            }
          }
        }
      }
}Running this query in the Insights GraphiQL Explorer should return something like this:
{
      "data": {
        "project": {
    	  "sessionData": {
    	    "sessions": {
    	      "resources": [{
    		    "meetings": {
    		      "resources": [{
    			    "publishers": {
    			      "resources": [{
    				    "stream": {
    					  "streamId": "e70fef65-f107-428b-9c03-02351812654f"
    					  },
    					  "streamStatsCollection": {
    					    "resources": [{
    						  "videoBitrateKbps": 6.61,
    						  "createdAt": "2020-03-22T12:24:05.407Z"
    						},{
    					      "videoBitrateKbps": 7.95,
    					      "createdAt": "2020-03-22T12:24:13.194Z"
    				        },{
    					      "videoBitrateKbps": 8.17,
    					      "createdAt": "2020-03-22T12:24:14.438Z"
    					    },{
    						  "videoBitrateKbps": 7.6,
    					      "createdAt": "2020-03-22T12:24:28.729Z"
    				        }]
    			          }
                        }]
    			      }
    			   }]
    		     }
    		  }]
    		}
          }
        }
      }
}This example result above is simplified. You might see multiple streams with a longer list of videoBitrateKbps fields if you had multiple publishers for that meeting and longer streams.
We now have a complete query that gives us all the data we need to recreate our publisher bitrate chart component! You are now ready to use this GraphQL query to build an interactive dashboard just like Inspector!

To get you started, we have a sample application that allows you to search for a session ID and get a chart showing the publisher bitrate information for that session. For this example, we built the dashboard using Apollo and React. (psst we also have a blog post that walks you through making GraphQL queries using Apollo.
Now that you know how to make an Advanced Insights query and how to use the Schema Explorer to get the fields you need, here are a few other useful queries to help you get the most out of Advanced Insights.
{
      project(projectId: Your API Key Here){
        sessionData{
          sessions(sessionIds: ["Your Session ID Here"]){
            resources{
              meetings{
                resources{
    		      publisherMinutes,
                  subscriberMinutes
                }
              }
            }
          }
        }
      }
    }
{
      project(projectId: Your API Key Here){
        sessionData{
          sessions(sessionIds: ["Your Session ID Here"]){
            resources{
              meetings{
                resources{
                  subscribers{
                    resources{
                      streamStatsCollection{
                        resources{
                          videoPacketLoss,
                          videoLatencyMs
                        }
                      }
                    }
                  }
                }
              }
            }
          }
        }
      }
}You're now ready to create your own custom queries and start learning more about how your customers experience your video application! Be sure to check out our other sample dashboard application which combines both project-level data from Insights and session-level data from Advanced Insights into a single dashboard for visualizing your video application data. Developer documentation on Insights and Advanced Insights can be found here.