Share:
Ori is a tech lead at Vonage Israel. He loves software, music, football, chess and animals.
Minimizing Production Headaches with Log Tracing
Let’s set the scene:
There’s been a critical incident in production. It’s up to you to find and solve it. You investigate the logs of the hundred different services and get totally lost. Which action caused which reaction? Is the error related to this API call, or this other one? We have all been there. And we can all unanimously agree that it is not fun.
But there is a solution. A solution that won't solve all of your production problems but it will help tremendously. And the good news is that it can be easily integrated into your services.
Log tracing.
Sounds simple, right? But in reality, it can be a powerful tool for almost any kind of investigation. Because in today’s modern architectures, when a user presses a single button in our site, it fires an API request to the API gateway, to a business service, to a database, to another service, to a centralized messages bus, to another service, and so on and so forth.
It’s an overwhelming journey that is inundated with hundreds of logs that are produced by every flow that happens hundreds of times per second by hundreds of thousands of users. Whew.
Before we jump into implementing these concepts, let's understand what we mean when we say we want to trace logs. Tracing usually means adding some identifier that can be used to aggregate data. The meaning of each ID is then a matter of taste. We can have one trace ID that is added to all the data in a single request. Or we can have a set of span IDs which will be used in the context of one service. The basic idea looks like this:
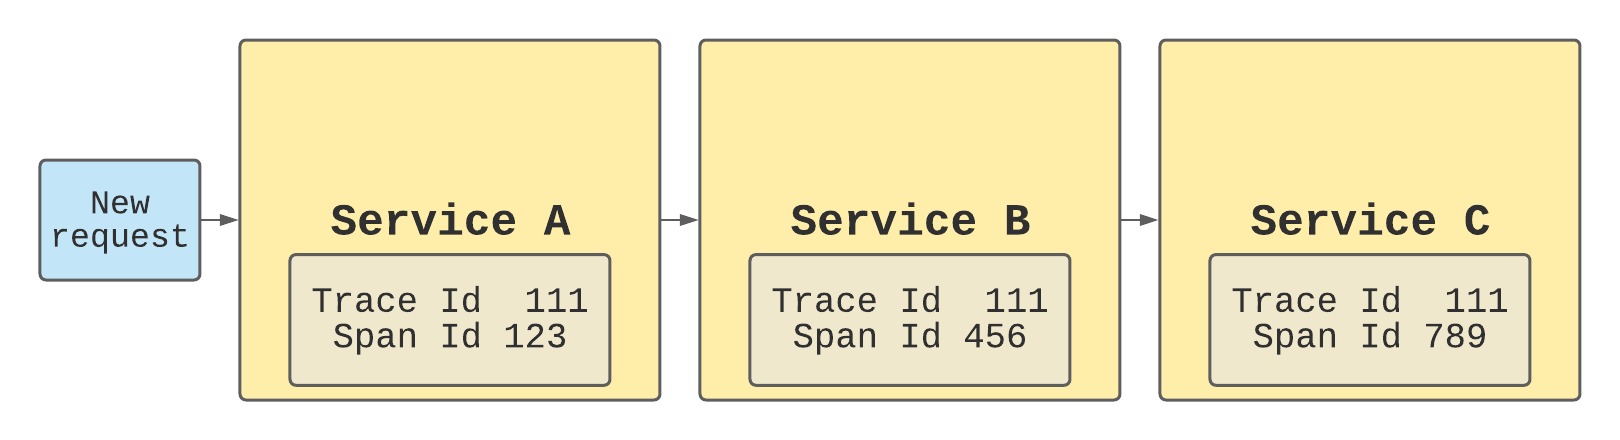 basic log tracing flow
There are two key concepts to understand:
Aggregate all logs from all services for each request via tracing
Let the infrastructure deal with the tracing so that it doesn't interfere with the business logic
So, how do we implement it?
This concept is pretty straightforward. We need to follow two very simple rules:
Add the trace ID to every log we write for a request and pass the trace ID whenever we make any IO operations.
If two services communicate on the same request via a messages bus, we will add to the message added to the bus the trace ID. If two services communicate via http requests, we will add the trace ID to the headers of the request. This way, we can follow a single request through its entire flow without any noise of other requests or logs occurring in parallel.
Ensuring that we can keep track of tracing through all sent or received data can require a good amount of coding. We always want to separate infrastructure concepts like this from the business logic as much as possible. Luckily, in our case, it is easy to split out the tracing management almost entirely.
In our code, we write logs for various events and errors while adding data to these logs. We want to keep these flows untouched while adding our tracing to all the logs in parallel. Most of the tools we use today allow us to add interceptors to each request they receive. If we make sure to add interceptors to our IO tool and our logging tool, we are on the path to ensuring that all logs will be traced without touching any of the existing code.
The easiest way to explain is by showing an actual example from our own services.
This code below from the nodejs service that receives http requests, writes several logs and then makes an http request to the next service. It is one of three places where we've placed interceptors: inbound request, logging, and outbound request.
function tracingMiddleware(req,res,next) {
    ns.run(() => {
        let traceId = req.headers['x-b3-traceid'];
        let spanId = req.headers['x-b3-spanid'];
        if (!traceId || !spanId) {
            traceId = uuid().replace(/-/g, '');
            spanId = uuid().replace(/-/g, '').substring(16);
        }
        ns.set('traceId', traceId);
        ns.set('spanId', spanId);
        next();
    });
}
We use Express as our API infrastructure to implement express middlewares that intercept each request. We extract the trace ID from the request or create a new one if we are the first service in the chain. We then set the trace ID in a session storage tool so we can fetch each in every step of the way.
Notice the ns.set. This is using cls-hooked, a continuation local storage package that wraps node async hooks. It allows us to locally store the trace ID for every session. But if you're using Node 14, this functionality is already built in with async local storage. What's cool about this method, though, is that it can be implemented in any language.
We then add an interceptor to the logging tool that grabs the trace ID from the session storage and adds it to every log line:
function createBunyanStreamMiddleware(streams) {
    return {
        type: 'raw',
        level: process.env.LOG_LEVEL,
        stream: {
            write: (entry) => {
                if(ns && ns.active) {
                    entry['traceId'] = ns.get('traceId');
                    entry['spanId'] = ns.get('spanId');
                }
                streams.forEach((stream) => {
                        stream.stream.write(entry)
                });
            }
        }
    }
}
Finally, we add an interceptor to the http tool that adds the trace ID to the request headers before the request is fired out:
function insertTracingHeaders(config = {}){
    if(ns && ns.active) {
        const traceId = ns.get('traceId');
        const spanId = ns.get('spanId');
        if (!config.headers) {
            config.headers = {};
        }
        if (traceId && spanId) {
            config.headers['x-b3-parentspanid'] = spanId;
            config.headers['x-b3-traceid'] = traceId;
        }
    }
    return config;
}
The entire flow will look something like this:
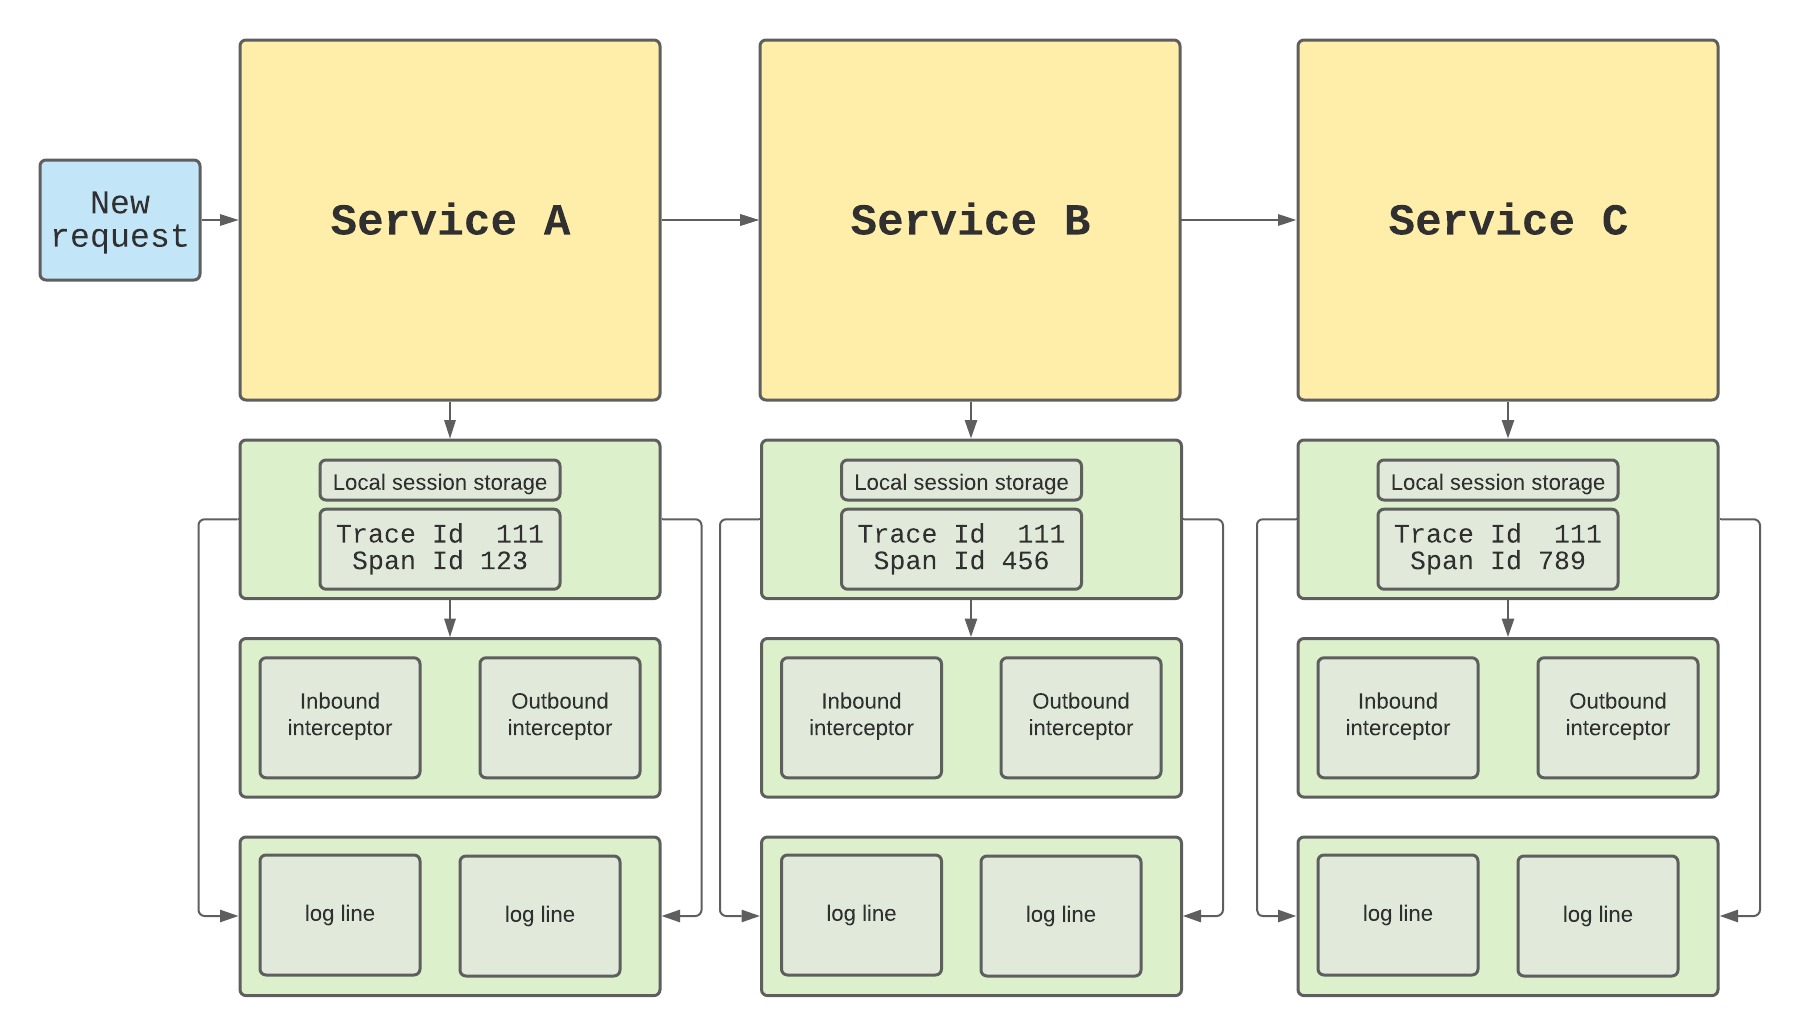 tracing flow with interceptors
Log tracing can be used in all sorts of contexts, but this particular use prevents a lot of headache when investigating errors. It ensures that the request logs of each flow are easily accessible, so that you don't need to dig through thousands of unrelated logs.
We can personally say that in the services where we applied these concepts, the efficiency and value experienced during log investigation has skyrocketed. Since then, sifting through logs in any other way just doesn’t feel right.
So, next time there's a critical incident in production, and it's up to you to solve it, at least this time the logs will be on your side.