Analytics and Logs Overview
The Verify Analytics and Logs sections in the Developer Dashboard allow you to monitor, search, and analyze activity associated with the Verify API. These tools offer valuable insights into the request data to help you understand your API usage and performance.
In this document, you can learn about:
- Verify Analytics - aggregated metrics and data from your Verify API.
- Verify Logs - transactions of your Verify requests.
Verify Analytics
The Verify Analytics section allows you to investigate and analyze aggregated metrics and data related to the Verify API usage and performance.
In this subsection, you will learn how to:
- Access Verify Analytics page.
- Interpret Verify Analytics view.
Access Verify Analytics
To access the Verify Analytics page:
- Go to the Developer Dashboard -> Analytics.
- Click Verify V2 Analytics.
Verify Analytics View
Once you open the Verify V2 Analytics page, you are taken to a dedicated view that presents insights into your Verify API usage and performance. This view includes a high-level summary of total requests, with detailed breakdowns by country and communication channel.
You also have the option to download the data as an Excel report by selecting the Download report button.
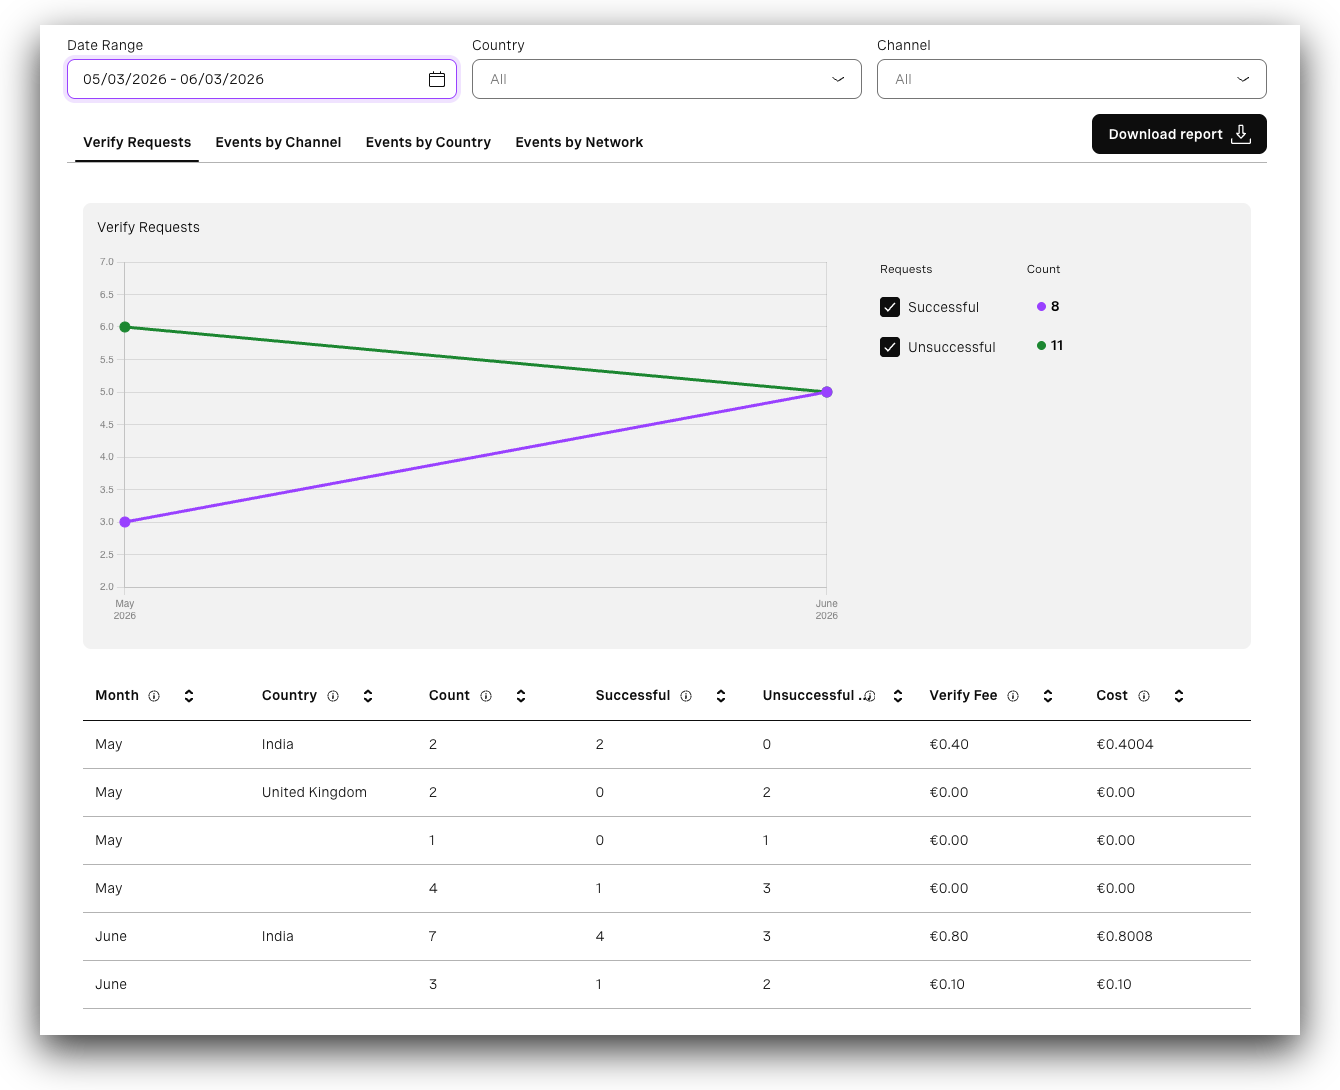
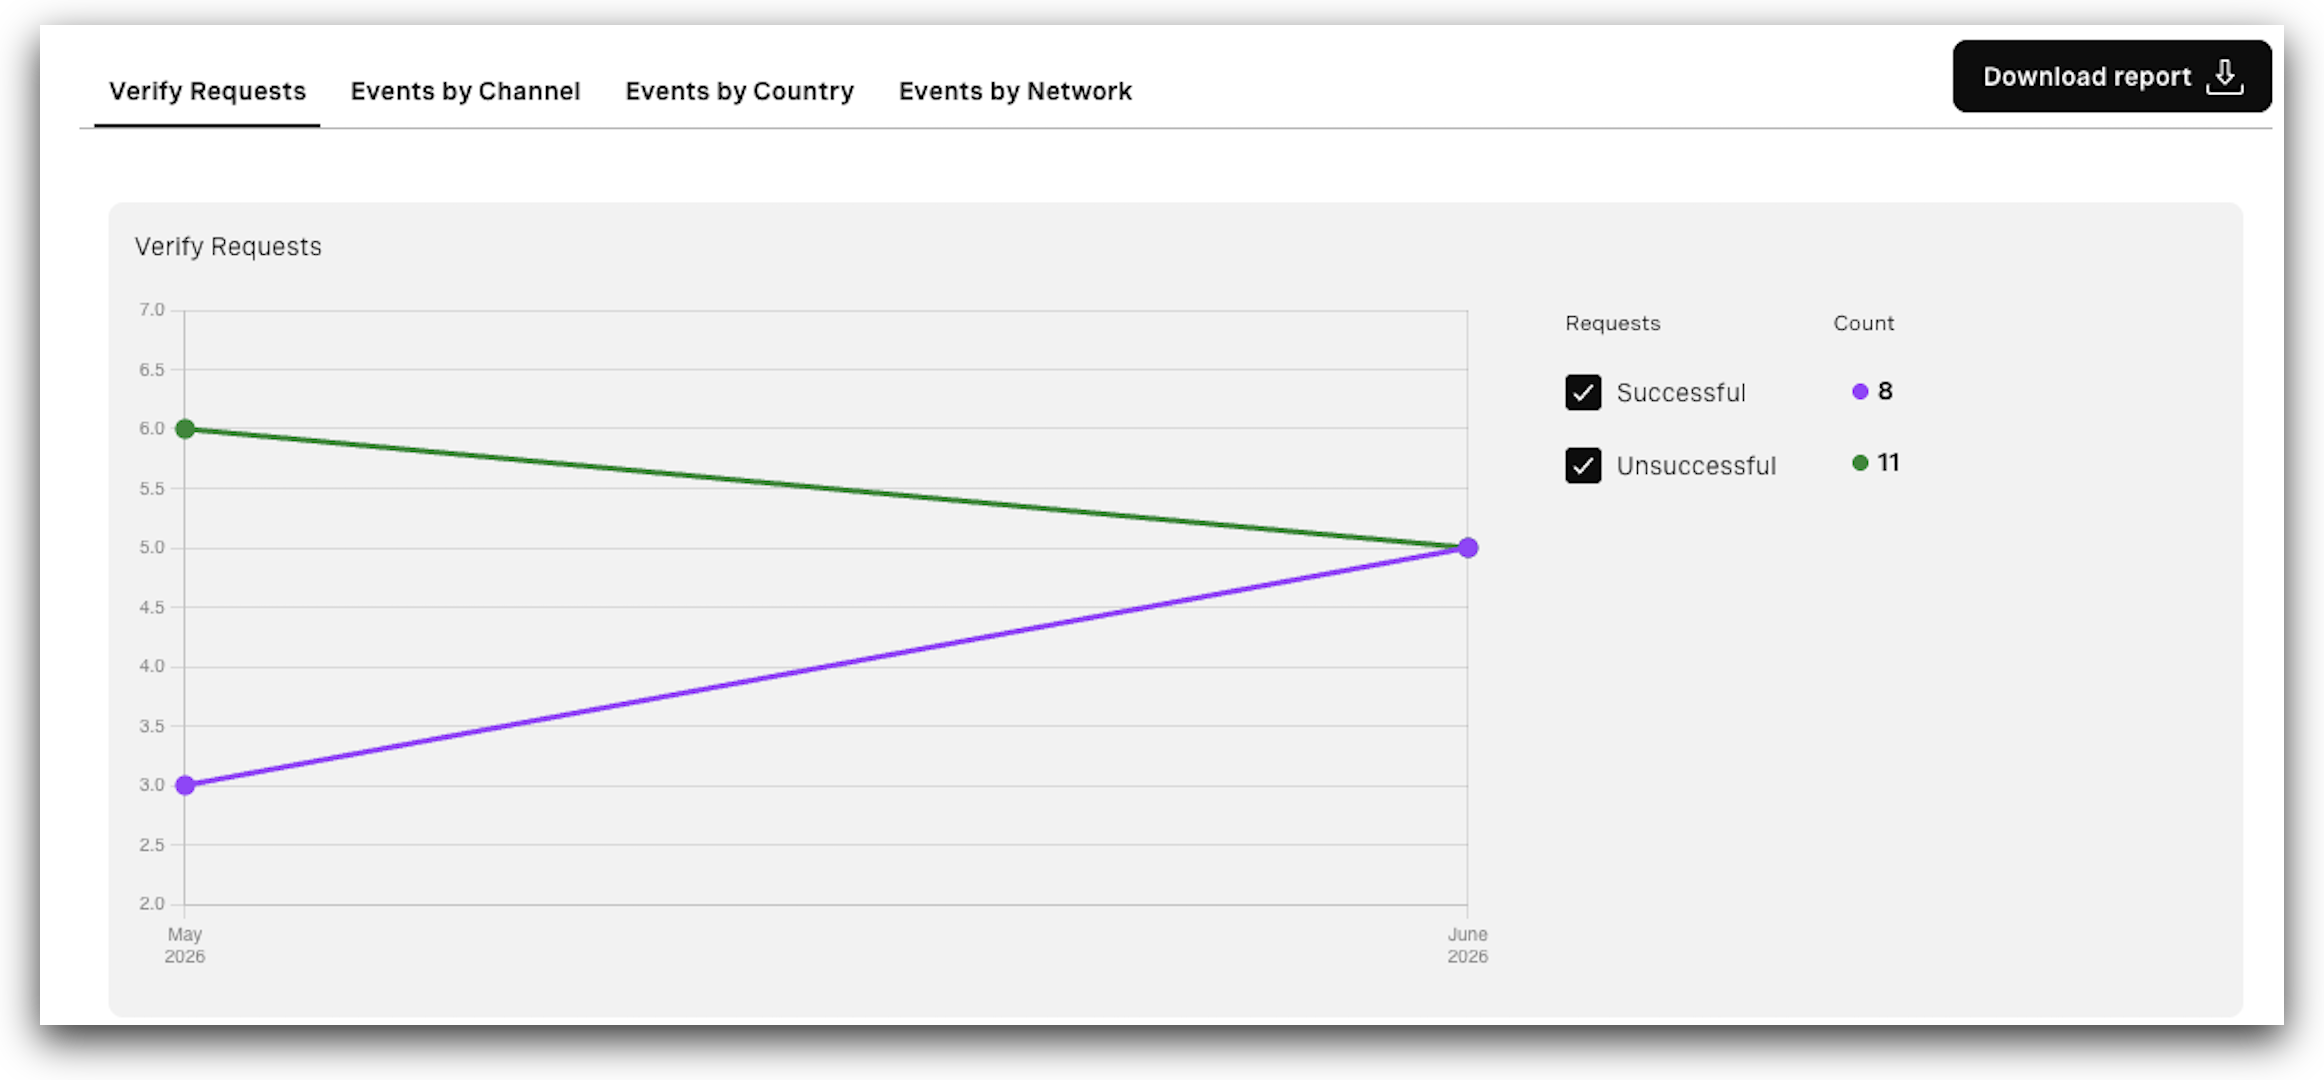
Verify Requests Tab
The Verify requests tab provides overall metrics for Verify API requests across a specific date range. It allows you to filter results using predefined time options or a custom date and time range.
The graph presents metrics:
- Successful - Count of converted (successful) requests. You can toggle them on or off.
- Unsuccessful - Count of requests other than successful (failed, expired, rejected, user_rejected, canceled, blocked). You can toggle them on or off.
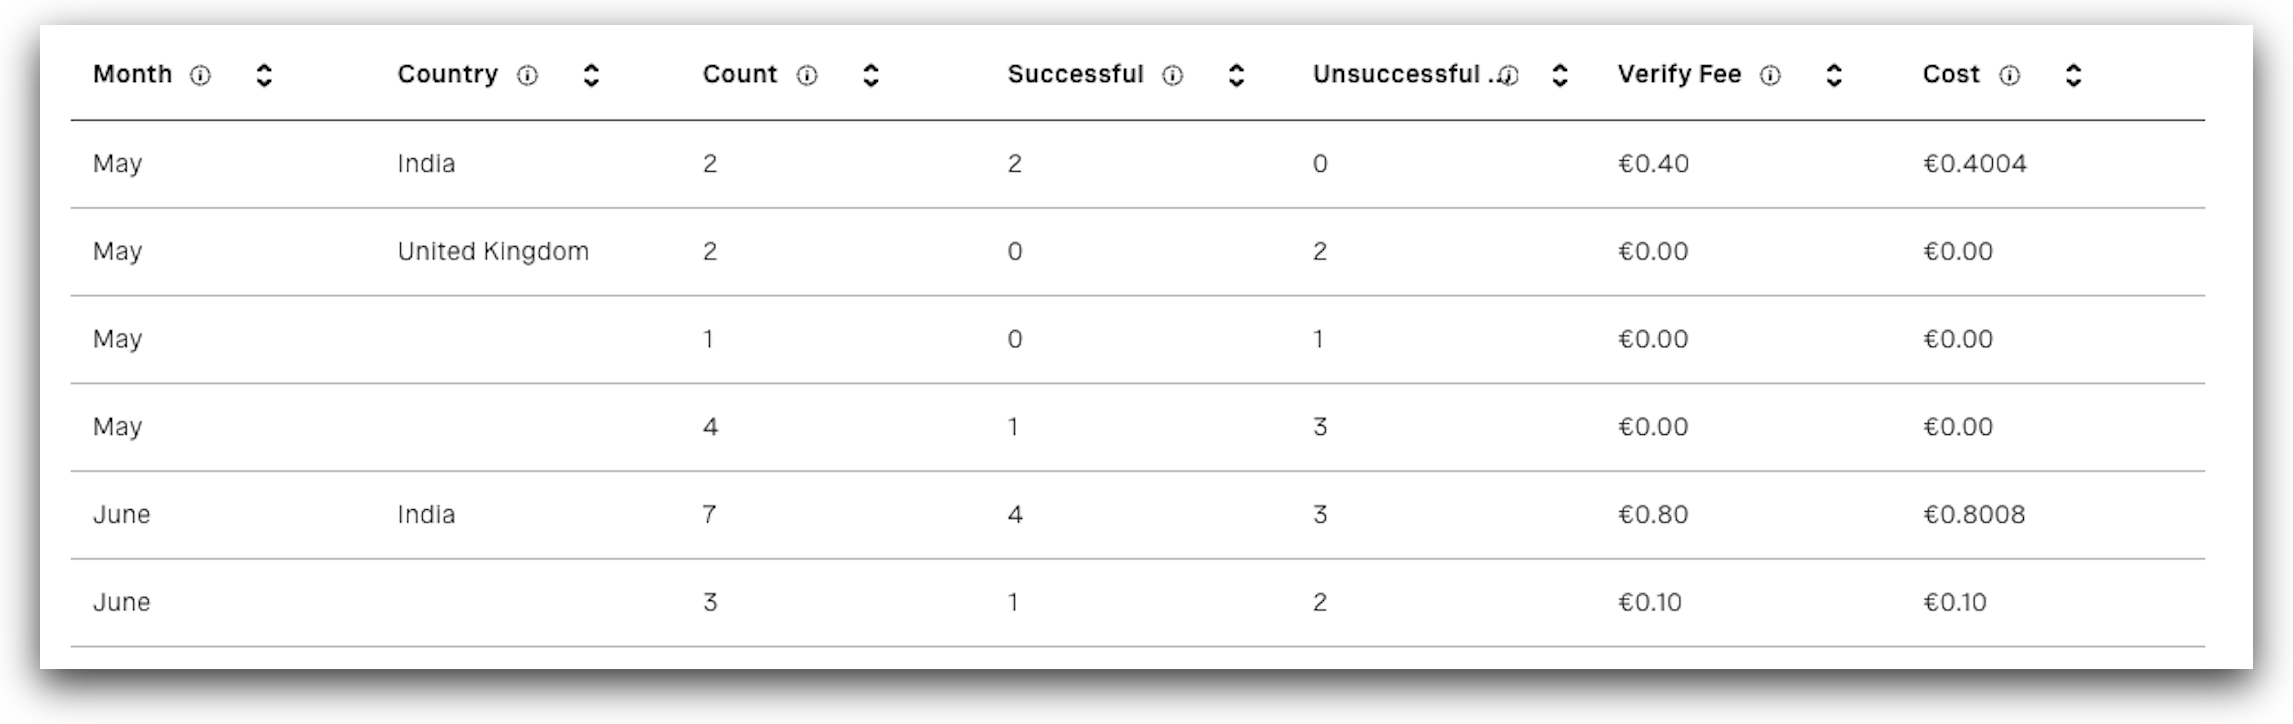
Beneath the graph, the table presents the request data broken down by months or weeks, depending on the filter selected. The table includes:
- Month - The month in which the request(s) were made.
- Country - Country for which requests were made.
- Count - Number of requests made during that period.
- Successful - Number of converted (successful) requests.
- Unsuccessful - Number of requests other than successful (failed, expired, rejected, user_rejected, canceled, blocked).
- Verify fee - Verify platform fee only.
- Cost - Verify platform fee plus the channel fee, depending on which channel(s) are used. For customers on Success pricing, the Total cost equals the Verify fee since no channel fee is charged. For customers not paying the Verify fee, the Total cost equals only the channel fee.
Channel Events Tab
The Events by Channel tab allows you to see how many requests were made for each supported channel.
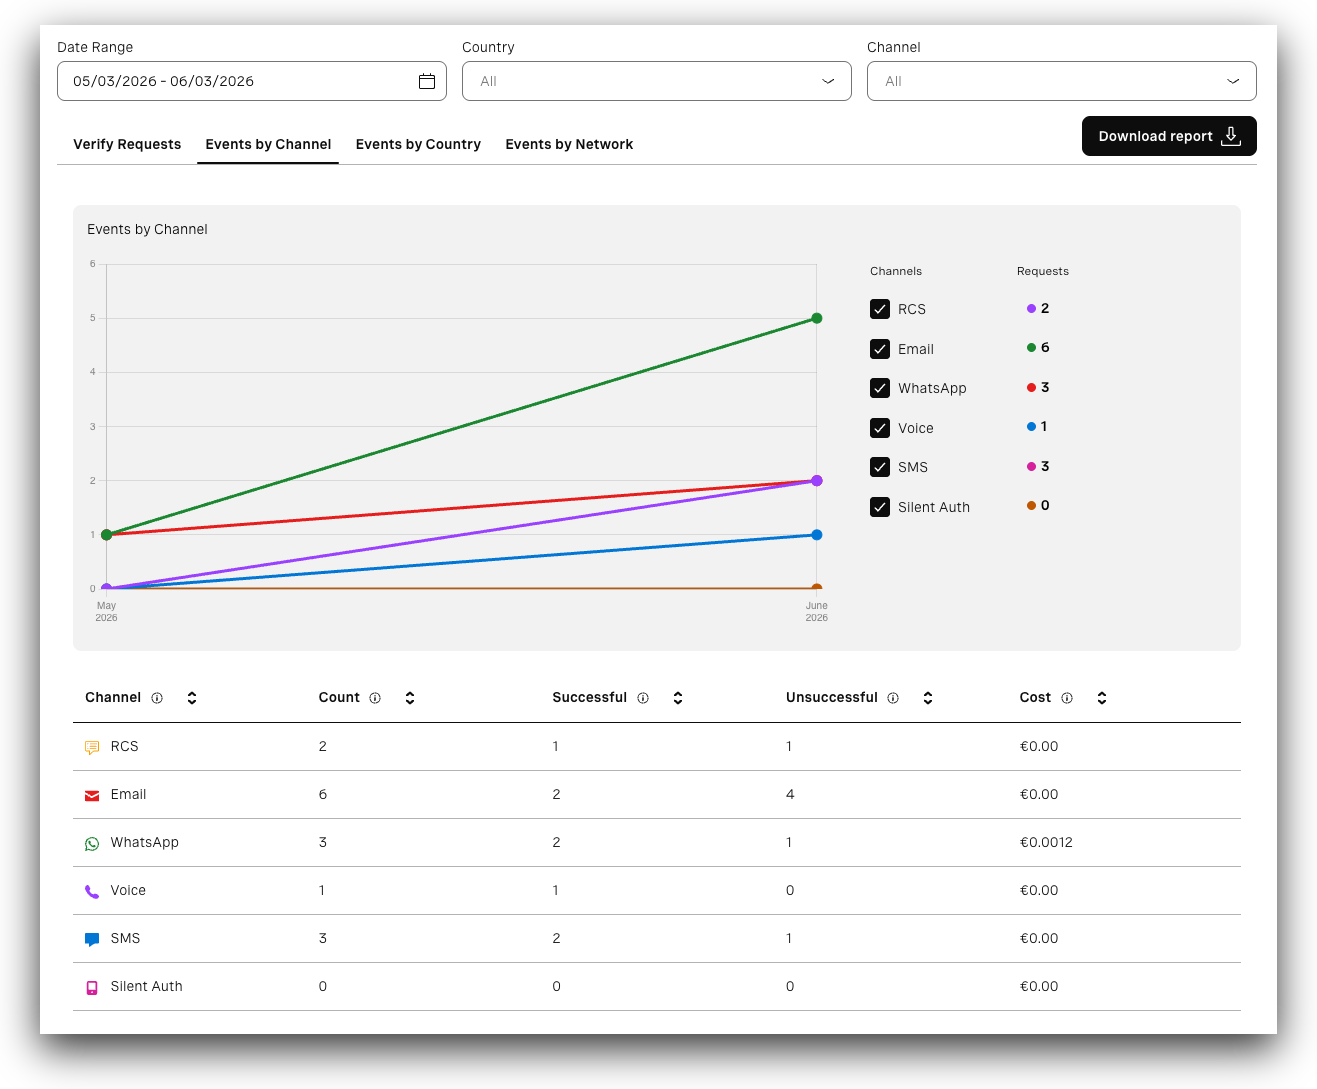
The graph represents the metrics and allows you to control what data is displayed:
- Channels - Specifies the channels. You can toggle specific channels on or off.
- Requests - Specifies how many requests were made per channel.
Beneath the graph, the table presents a breakdown by channel. It includes:
- Channel - Specifies the channel.
- Count - Number of requests made for a specific channel.
- Successful - Number of converted (successful) requests.
- Unsuccessful - Number of requests other than successful (failed, expired, rejected, user_rejected, canceled, blocked).
- Cost - Verify platform fee plus the channel fee, depending on which channel(s) are used. For customers on Success pricing, the Total cost equals the Verify fee since no channel fee is charged. For customers not paying the Verify fee, the Total cost equals only the channel fee.
Events by Country
The Events by Country tab allows you to see how many requests were made per country.
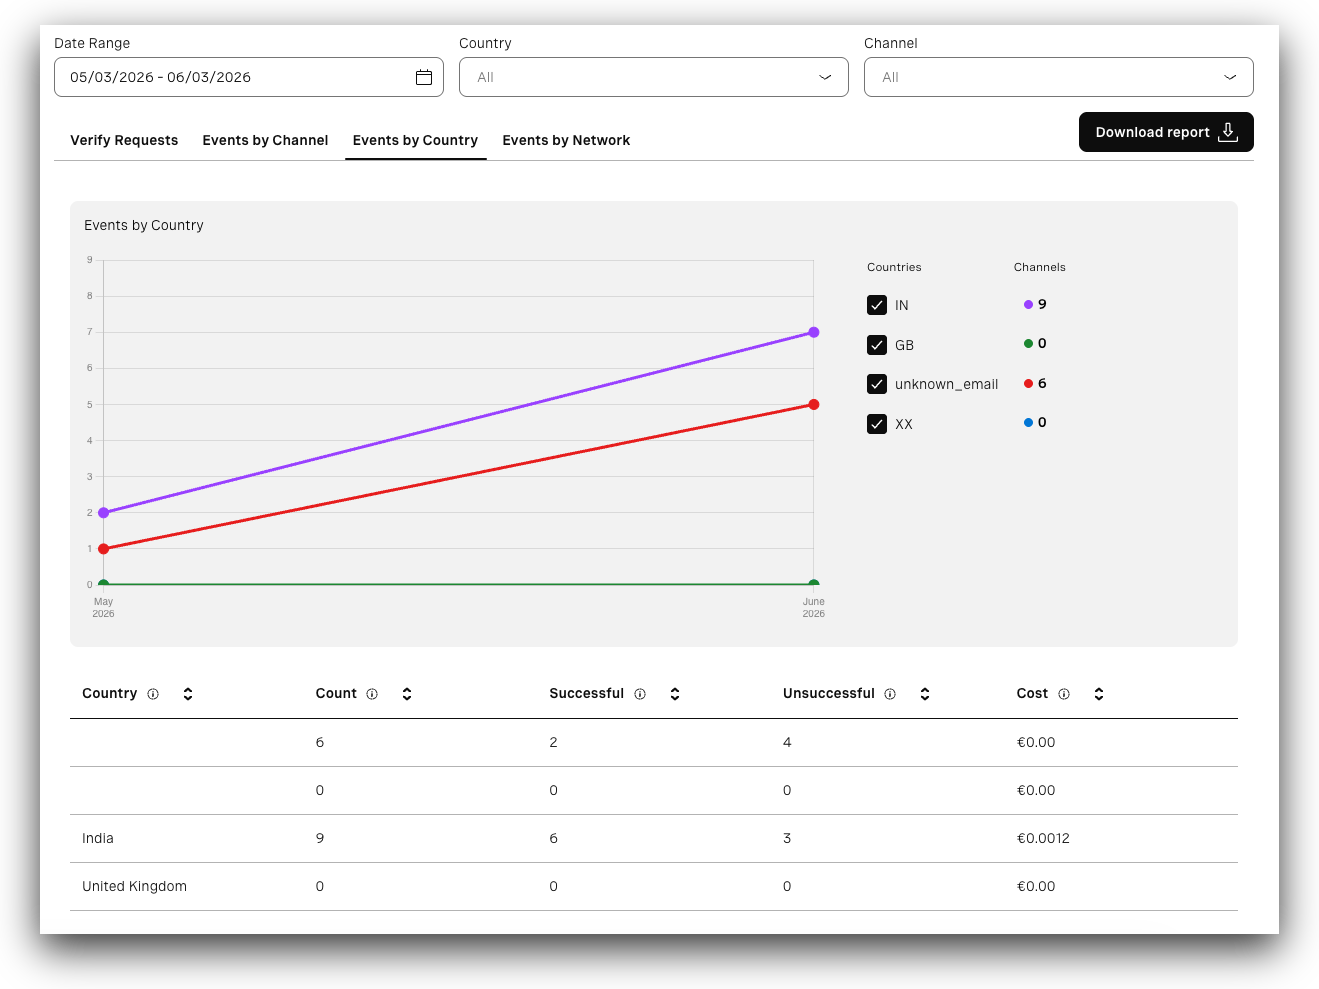
The graph represents the metrics and allows you to control what data is displayed:
- Countries - Specifies the countries. You can toggle specific countries on or off.
- Channels - Specifies how many requests were made per country.
The unknown_email indicates Email country usage, which lacks an associated country.
Beneath the graph, the table presents a breakdown by country. It includes:
- Country - Country for which requests were made.
- Count - Number of requests made for a specific country.
- Successful - Number of converted (successful) requests.
- Unsuccessful - Number of requests other than successful (failed, expired, rejected, user_rejected, canceled, blocked).
- Cost - Verify platform fee plus the channel fee, depending on which channel(s) are used. For customers on Success pricing, the Total cost equals the Verify fee since no channel fee is charged. For customers not paying the Verify fee, the Total cost equals only the channel fee.
Events by Network
The Events by Network tab allows you to see how many requests were made per each network.
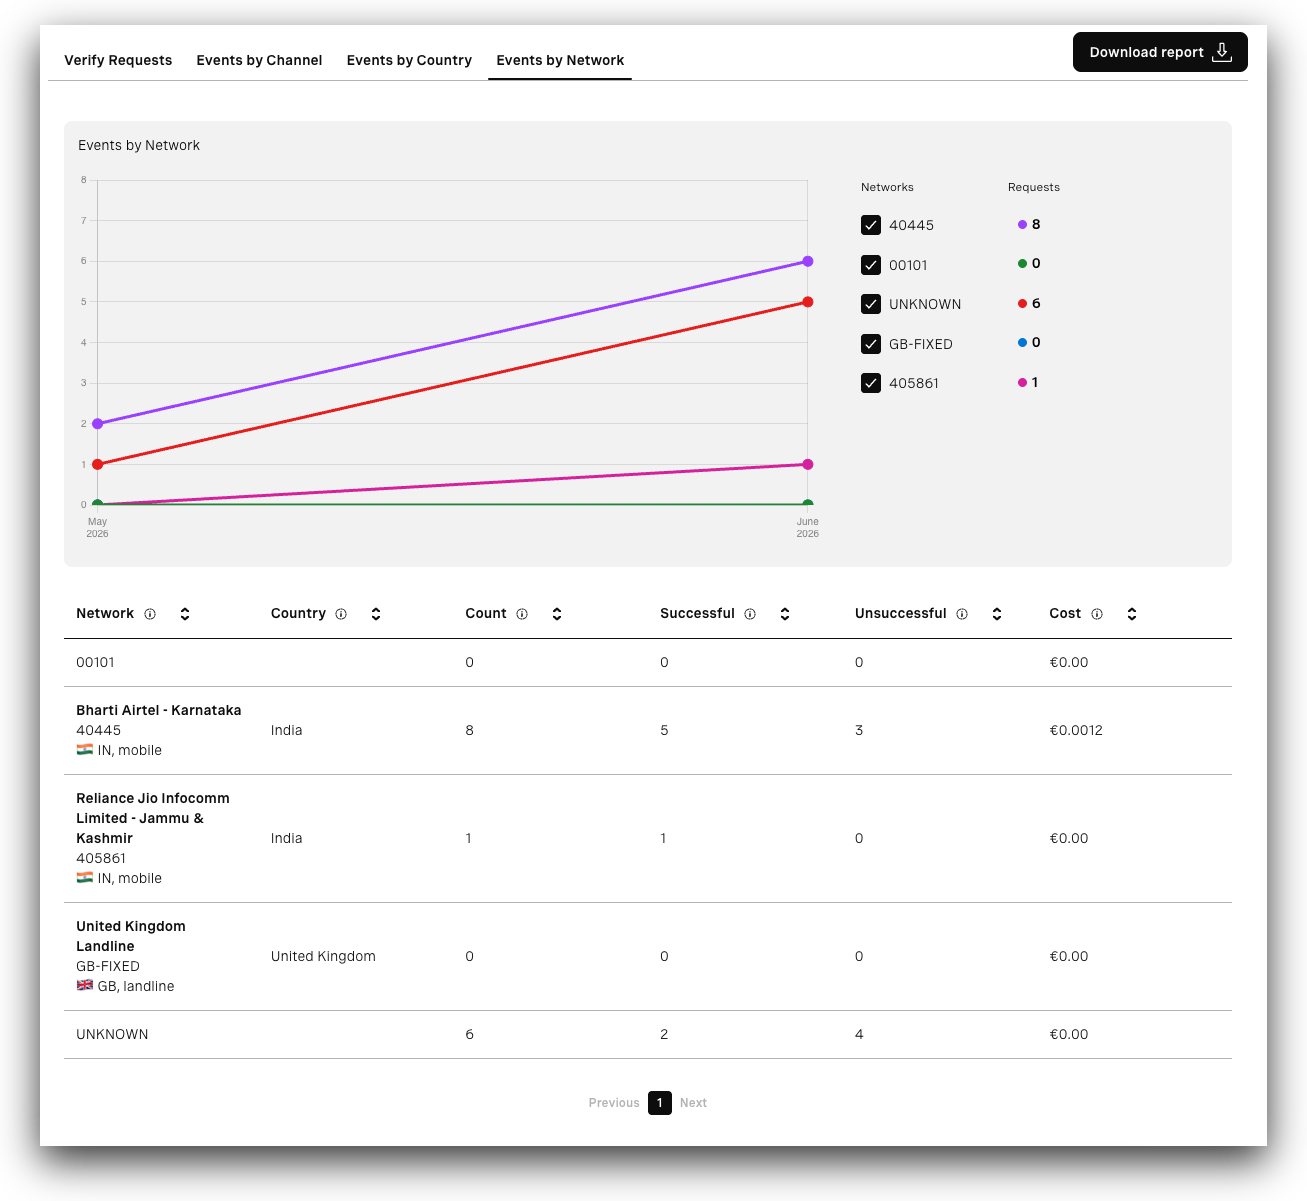
The graph represents the metrics and allows you to control what data is displayed:
- Networks - Specifies the networks. You can toggle specific networks on or off.
- Requests - Specifies how many requests were made per network.
The UNKNOWN indicates Email country usage, which lacks an associated country.
Beneath the graph, the table presents a breakdown by network. It includes:
- Network - Network for which requests were made.
- Country - Country for which requests were made.
- Count - Number of requests made for a specific network.
- Successful - Number of converted (successful) requests.
- Unsuccessful - Number of requests other than successful (failed, expired, rejected, user_rejected, canceled, blocked).
- Cost - Verify platform fee plus the channel fee, depending on which channel(s) are used. For customers on Success pricing, the Total cost equals the Verify fee since no channel fee is charged. For customers not paying the Verify fee, the Total cost equals only the channel fee.
Verify Logs
The Verify Logs section allows you to explore and analyze transactions of your Verify requests.
In this subsection, you will learn how to:
- Access Verify Logs page.
- Interpret the Search verification requests view.
- Interpret the Search verification requests table.
The Verify Logs section includes results only for Verify (v2), Silent Authentication, and Email channels. Logs for RCS, SMS, WhatsApp, and Voice are displayed in their respective logs sections in the Developer Dashboard. Please note that RCS and WhatsApp logs are shown under Messages Logs.
Access Verify Logs
To access the Verify Logs page:
- Go to the Developer Dashboard -> Logs.
- Click Verify Logs -> Verify V2.
Search Verification Requests View
After opening the Verify Logs page, you are redirected to the Search verification requests view.
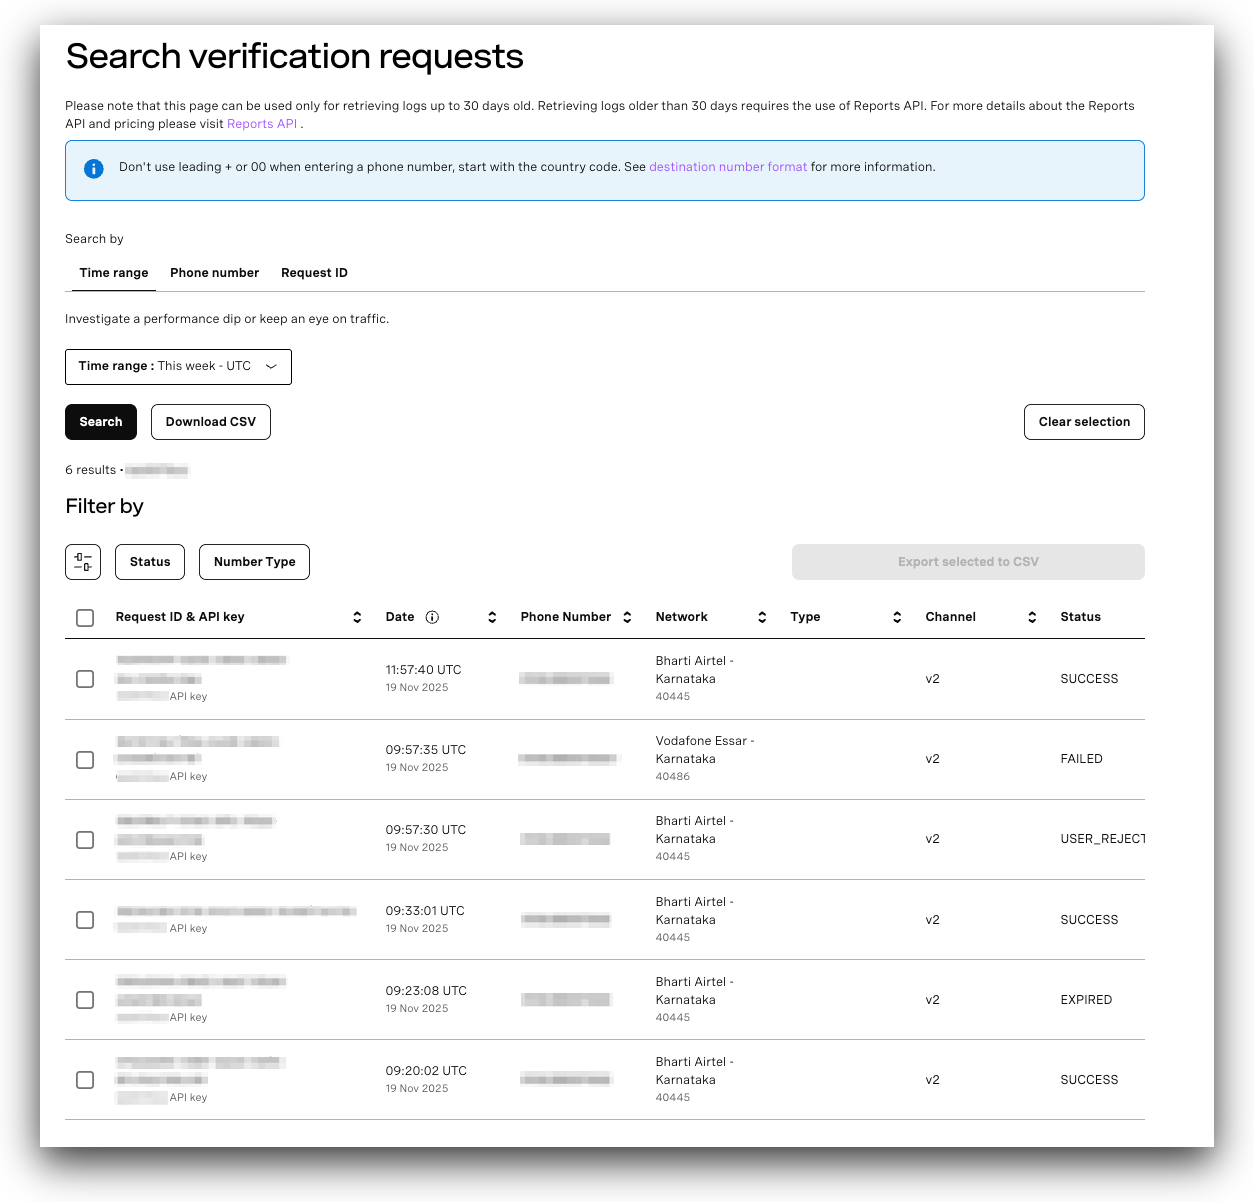
The view allows you to search your logs by:
- Time range - Search up to 30 days of data using options from the dropdown, or by selecting the custom time range and date. For logs older than 30 days, you need to use the Reports API.
- Phone Number - Search logs by entering the ‘To’ number and selecting a Time range.
- Request ID - Search for specific logs by their Request IDs.
After selecting your filters, the table displaying all the matching results will be shown. Because Verify supports various channels, each Verify request you initiate results in distinct requests:
- One for Verify itself, represented by v2 in the results.
- Another one(s) for the specific channel(s) being used.
That is why the table always shows multiple requests for each of the Verify requests made.
The Search verification requests view includes results only for Verify (v2), Silent Authentication, and Email channels. Logs for RCS, SMS, WhatsApp, and Voice are displayed in their respective logs sections in the Developer Dashboard. Please note that RCS and WhatsApp logs are shown under Messages Logs.
Search Verification Requests Table
The Search verification requests table displays detailed information for each request returned by your filters.
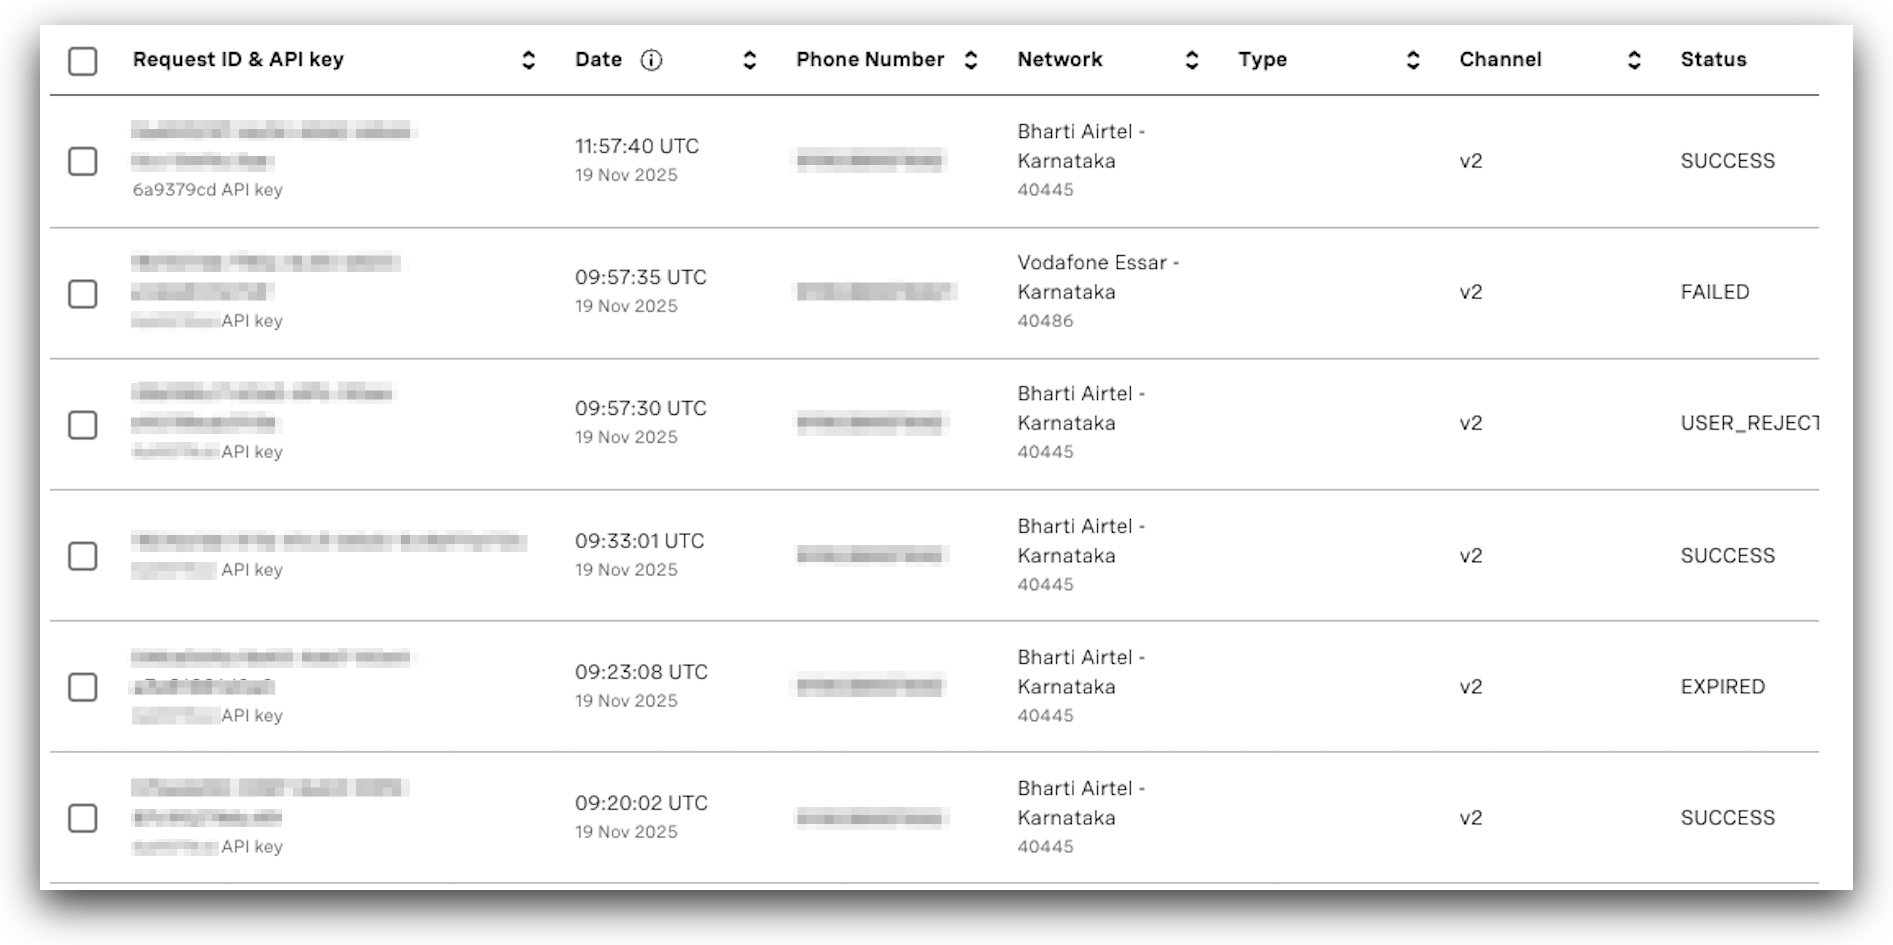
You can find the following columns in the table with the results:
- Request Id & API key - Identifies a specific request and its API key.
- Date - Time when the request was made.
- Phone Number - The destination phone number to which the request was made.
- Network - The network associated with the phone number.
- Channel - Shows which channel the request belongs to:
- v2 - specific for the Verify request. Represents the verify platform fee record.
- email - specific for the Email channel request.
- silent auth - specific for the Silent Authentication channel request.
- Status - Shows the status of the Verify requests. Refer to the Status table for details on each status.
- Price - Pertains to the Verify fee and the associated channel fee for each individual record.
Interpreting Search Verification Requests Table
When interpreting the Search verification requests table, remember that Verify logs display each request separately, even when multiple channels are used within a single verification flow. Each attempt is logged independently, with its own channel, status, price, etc. As a result, a single verification may generate multiple log records: one for the v2 request and additional ones for each channel involved.
For example, when Silent Authentication and SMS are used together, and the request fails over from Silent Authentication to SMS, the related requests appear separately:
- The silent_auth request appears with a status of FAILED.
- The SMS request appears with a status of DELIVERED.
This behavior is expected, as each channel attempt is processed and logged independently.
Status Table
The table presents the details for each status of Verify requests:
| Status | Description |
|---|---|
| SUCCESS | A chargeable transaction confirming that the Authentication request completed successfully. |
| DELIVERED | A chargeable transaction indicating that the selected channel completed successfully and the user was authenticated. |
| FAILED | A non-chargeable transaction that reached a final status but did not successfully complete authentication. |
| EXPIRED | The Authentication flow did not reach a final status. This may occur when users lack adequate mobile data conditions to complete the flow (in the case of silent authentication), or when the flow is triggered but stalls at initiation due to missing input or insufficient progress. |
| USER_REJECTED | The OTP entered during verification was incorrect. The user is allowed up to three attempts for OTP-based channels. |
| CANCELLED | The verification process was terminated before reaching a final status. |
| BLOCKED | The verification was halted due to fraud prevention mechanisms, such as Conversion Alerts (velocity rules) or Fraud Defender-related rejects. Note: Some verification traffic may be blocked automatically by fraud-prevention rules configured in Fraud Defender. Refer to the Fraud Defender documentation for details on conversion alerts and automated network blocking. |