Video Analytics
Monitor your Video API usage with detailed metrics including session activity, participant counts, quality scores, and bandwidth consumption across all your video applications.
Access Video Analytics
- Log in to your Vonage Dashboard
- Navigate to Monitor → Analytics → Video in the left sidebar.
Filter Your Data
Use the filter controls at the top to narrow your analytics:
Date Range
Select the time period to analyze:
- Click the date range picker to choose start and end dates
- Custom date ranges available
- Example: "01/01/2026 - 02/28/2026"
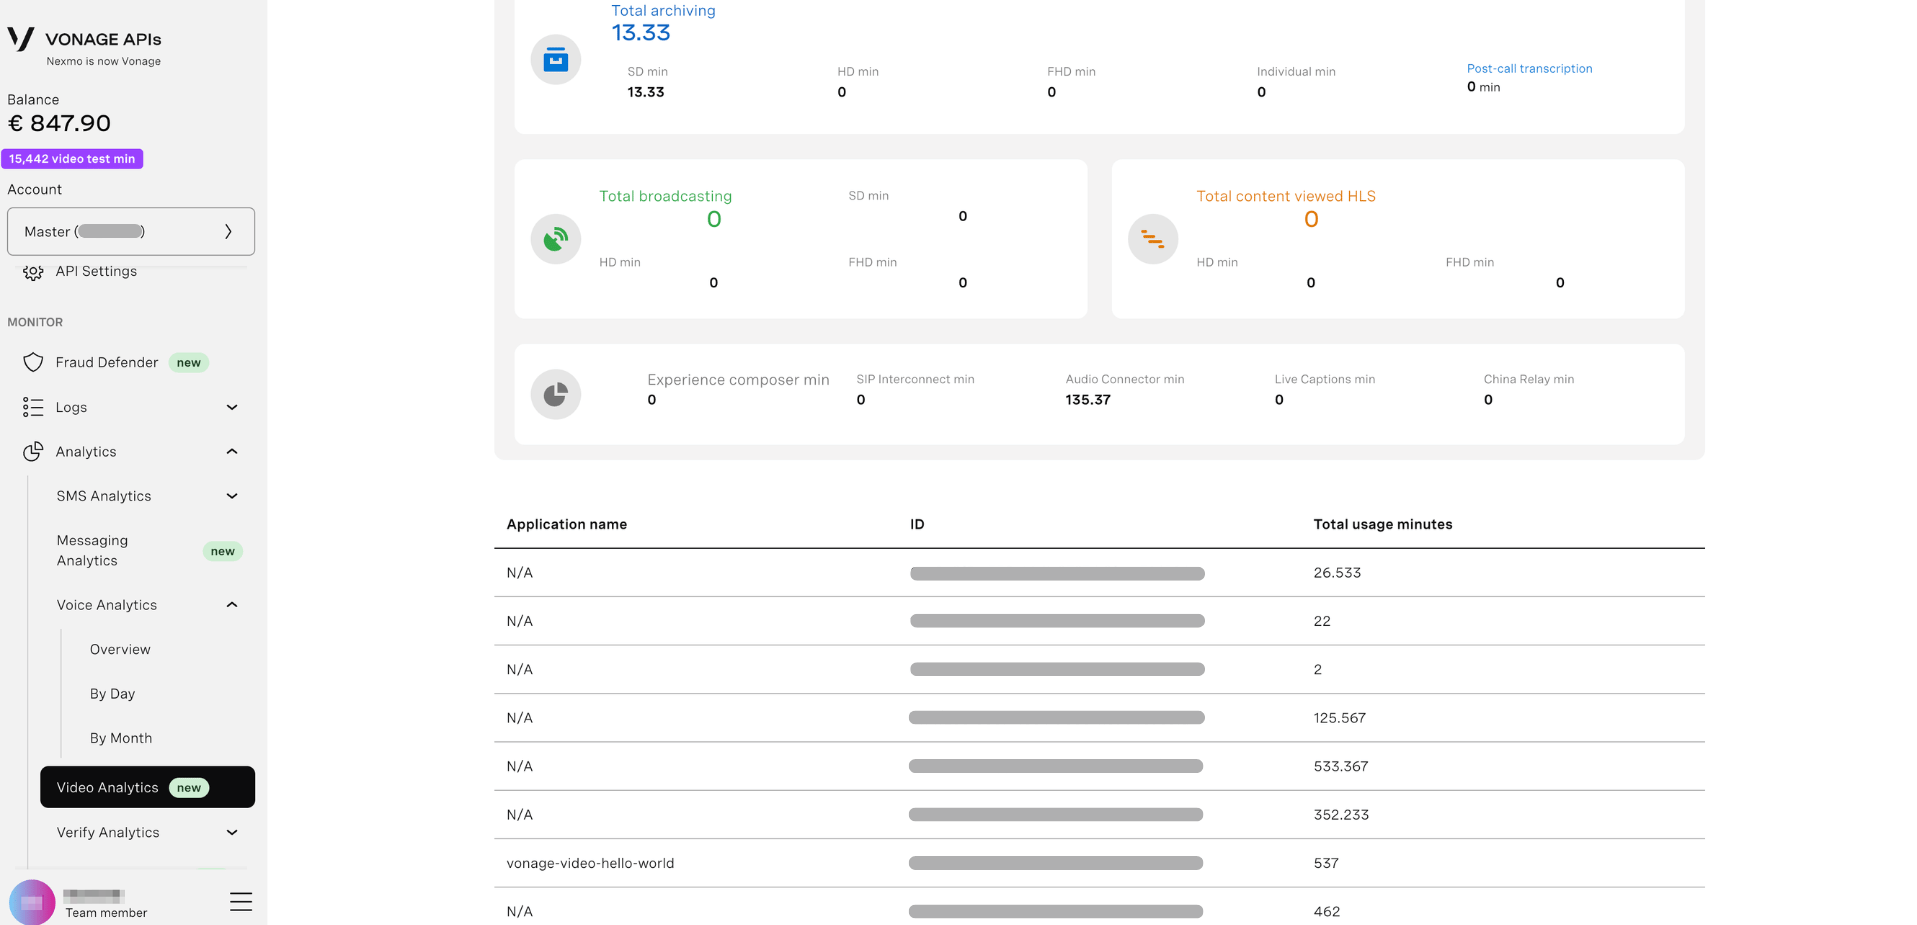
Application
Filter by specific Video application:
- Dropdown menu - Select from your Video applications
- View data for individual apps or combined
- Application ID displayed (e.g., "vonage-anagram-LPyA2h")
View Mode
Toggle between two display modes:
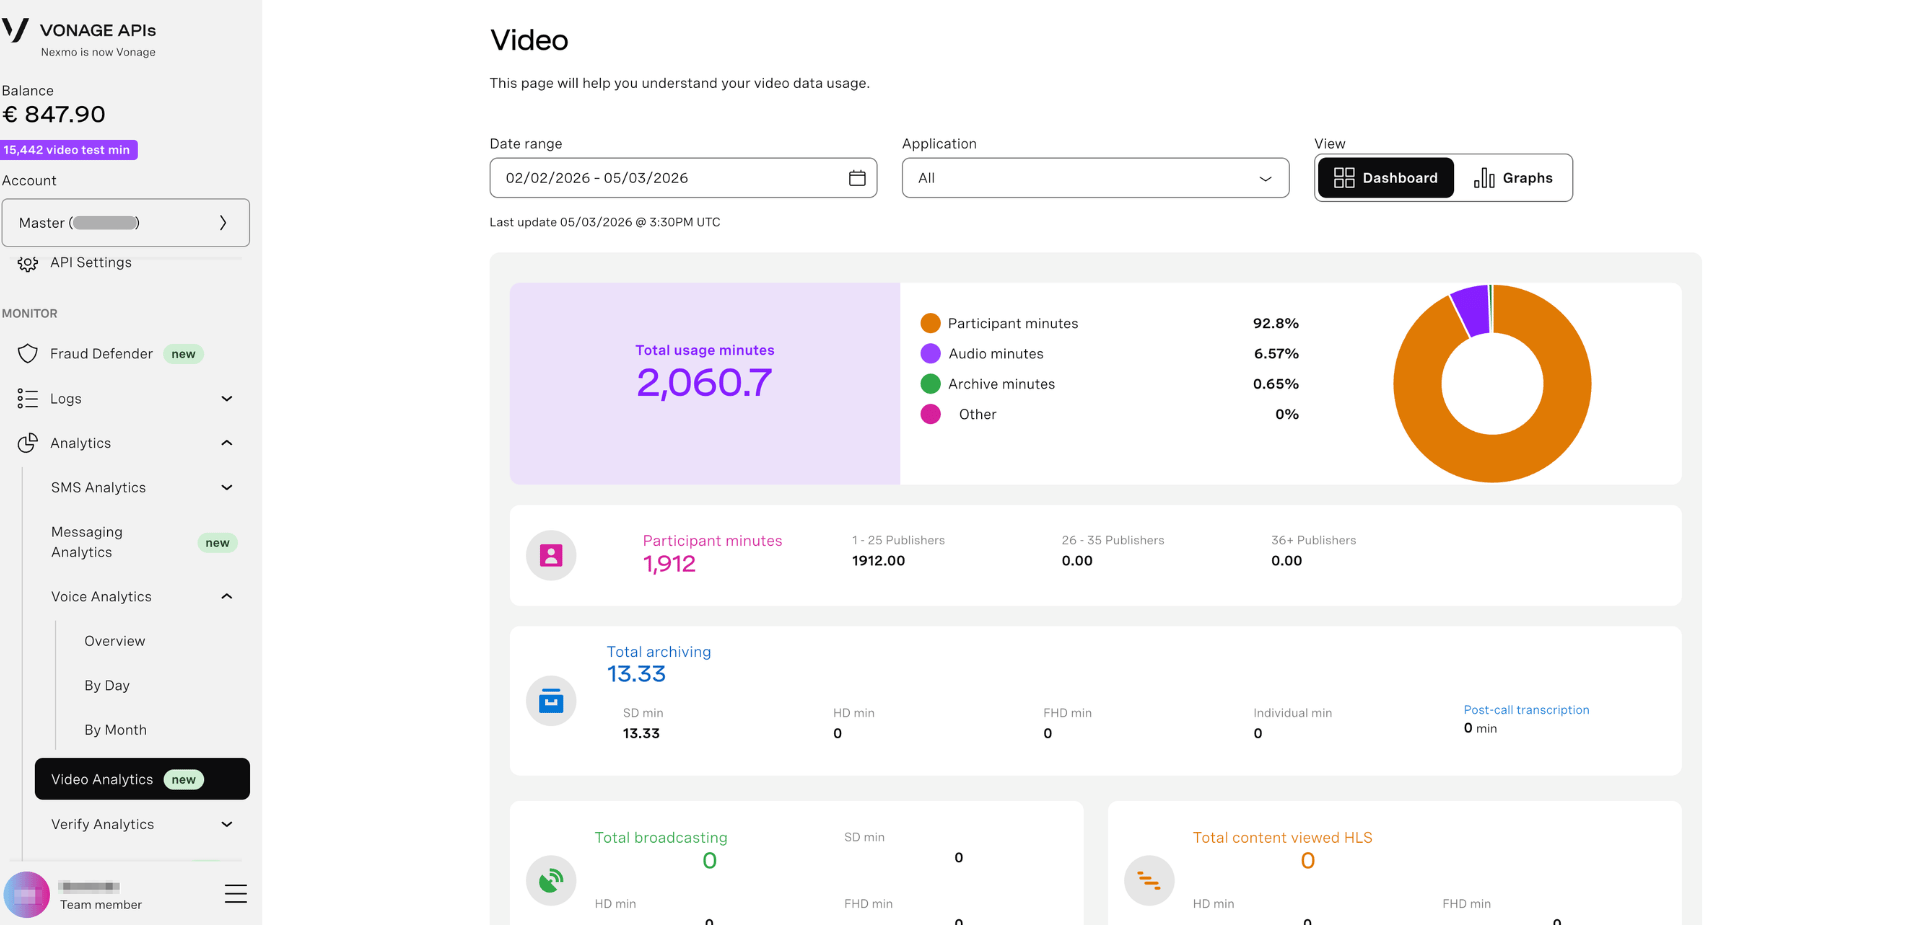
- Dashboard - Grid view with metric cards
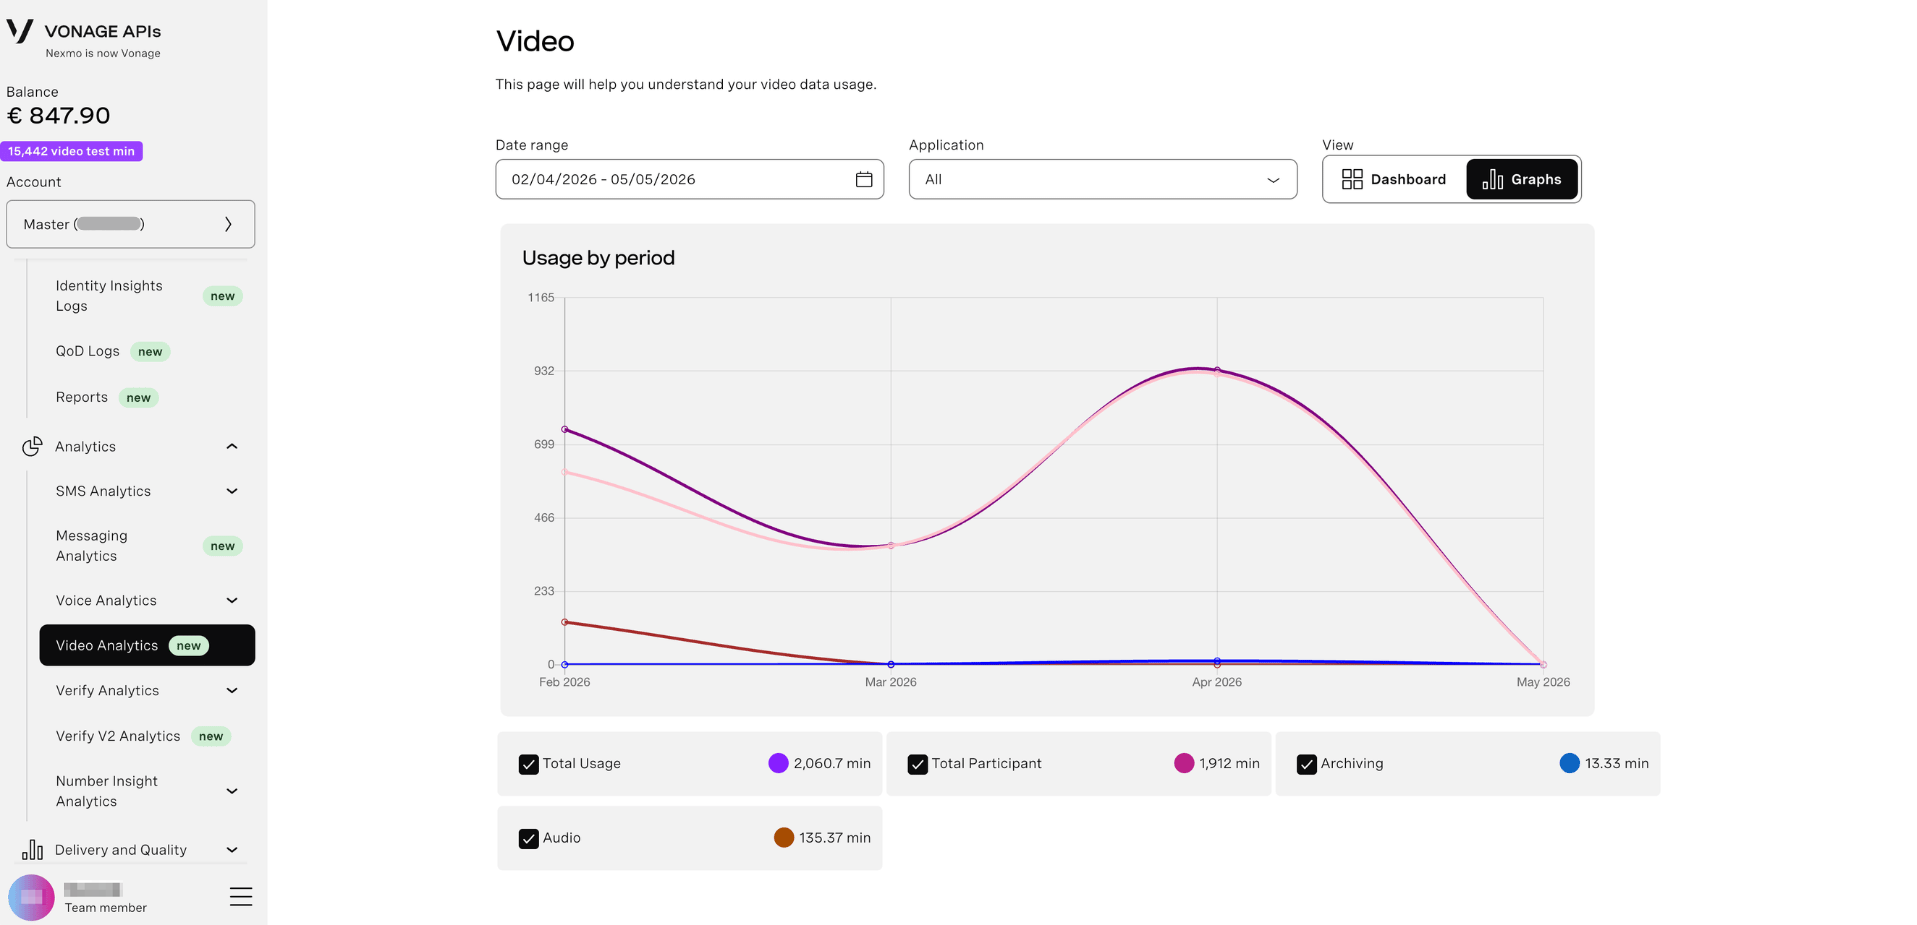
- Graphs - Visual chart representations (default)
View Analytics Tabs
Switch between different analytics views using the tabs:
Usage Tab
Track video session activity and consumption patterns.
Visualization Options:
Choose how to view your usage data:
- Line graph - Time-series view of usage trends
- Map View - Geographic distribution of video sessions
- Pie Chart - Proportional breakdown of usage metrics
Usage by Period Graph:
- Line chart - Shows usage trends over time
- X-axis - Date range (e.g., Jan 2026 to Feb 2026)
- Y-axis - Usage metric (scaled 0 to 1.0 or actual values)
- Grid lines - Easy-to-read reference points
- Interactive - Hover to see exact values at specific dates
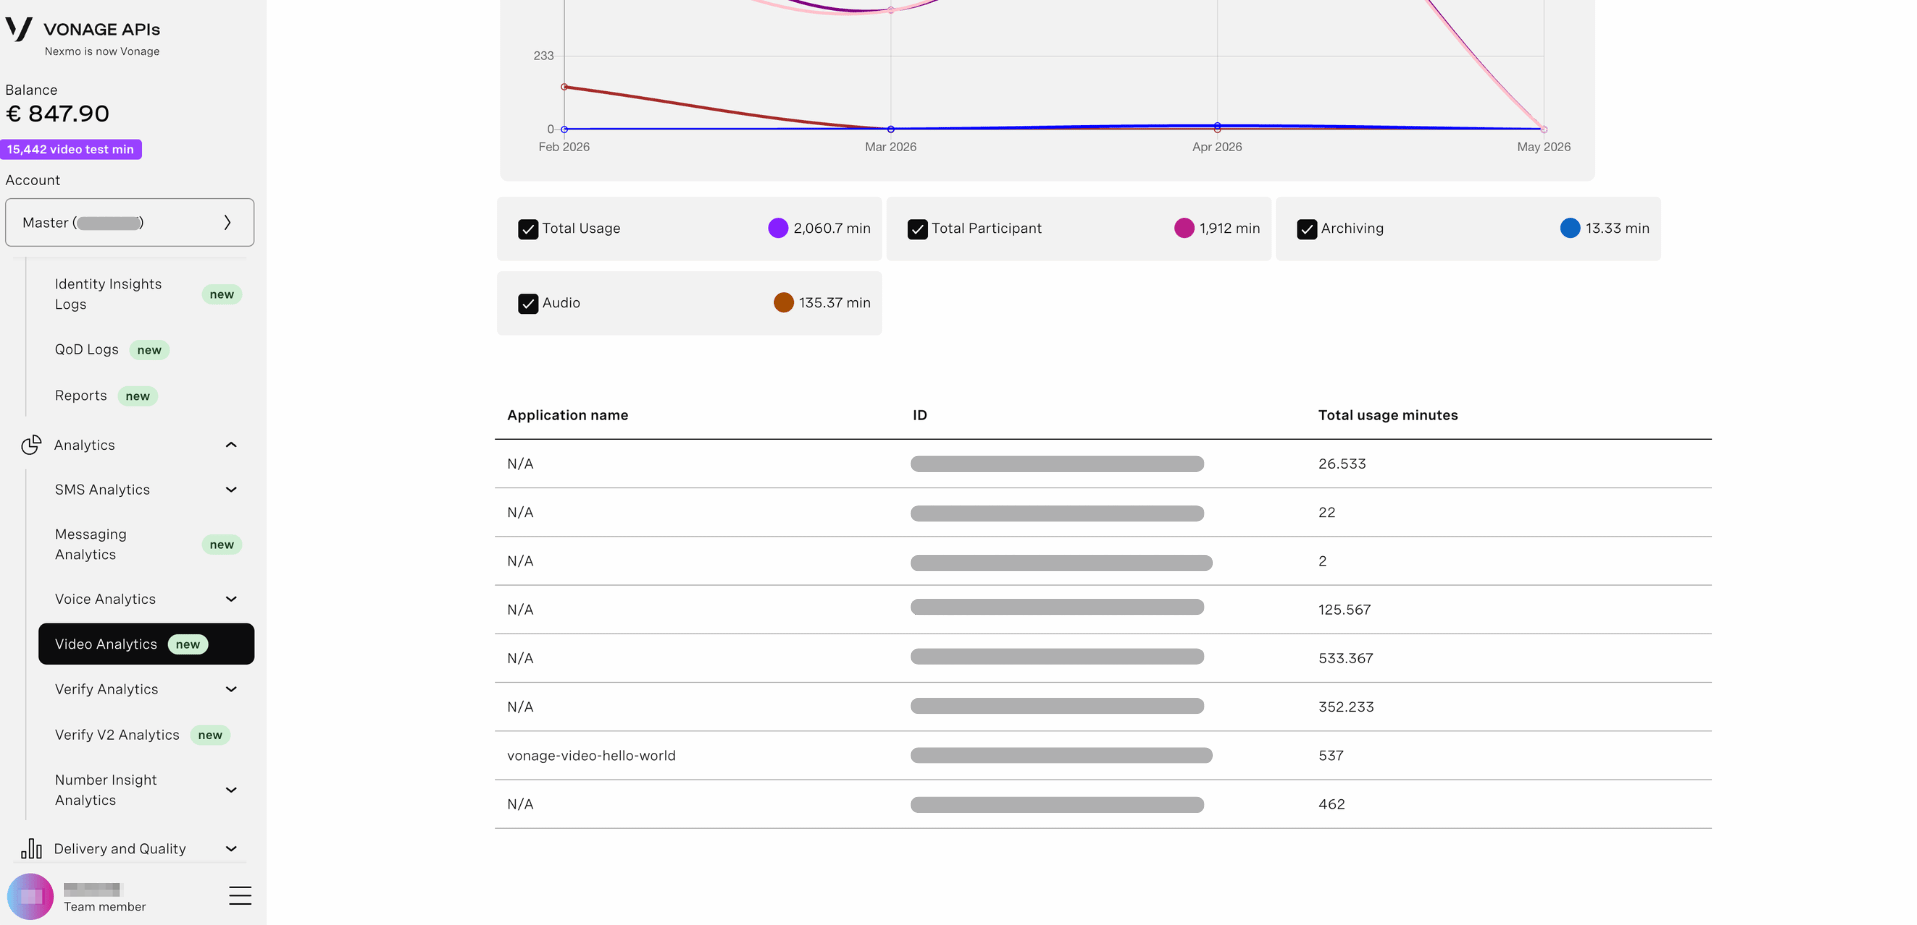
Metrics tracked:
- Total session minutes
- Number of sessions
- Participant counts
- Archive and recording usage
- Bandwidth consumption