Verify Analytics
The Verify Analytics section allows you to investigate and analyze aggregated metrics and data related to the Verify API usage and performance.
In this subsection, you will learn how to:
- Access Verify Analytics page.
- Interpret Verify Analytics view.
Access Verify Analytics
To access the Verify Analytics page:
- Go to the Developer Dashboard -> Analytics.
- Click Verify V2 Analytics.
Verify Analytics View
Once you open the Verify V2 Analytics page, you are taken to a dedicated view that presents insights into your Verify API usage and performance. This view includes a high-level summary of total requests, with detailed breakdowns by country and communication channel.
You also have the option to download the data as an Excel report by selecting the Download report button.
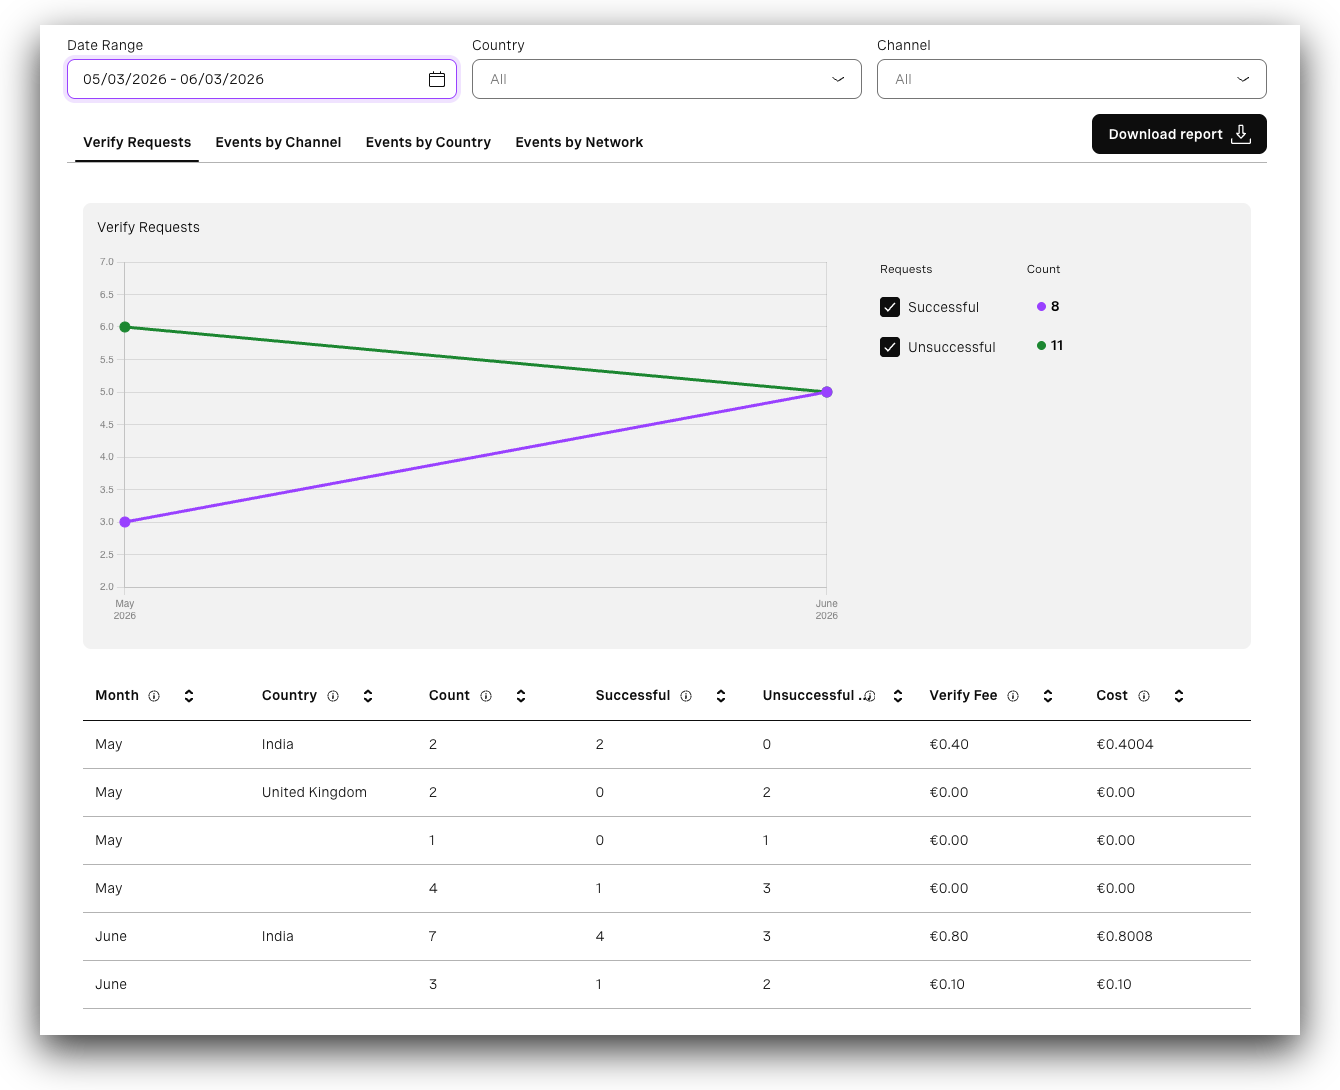
Verify Requests Tab
The Verify requests tab provides overall metrics for Verify API requests across a specific date range. It allows you to filter results using predefined time options or a custom date and time range.
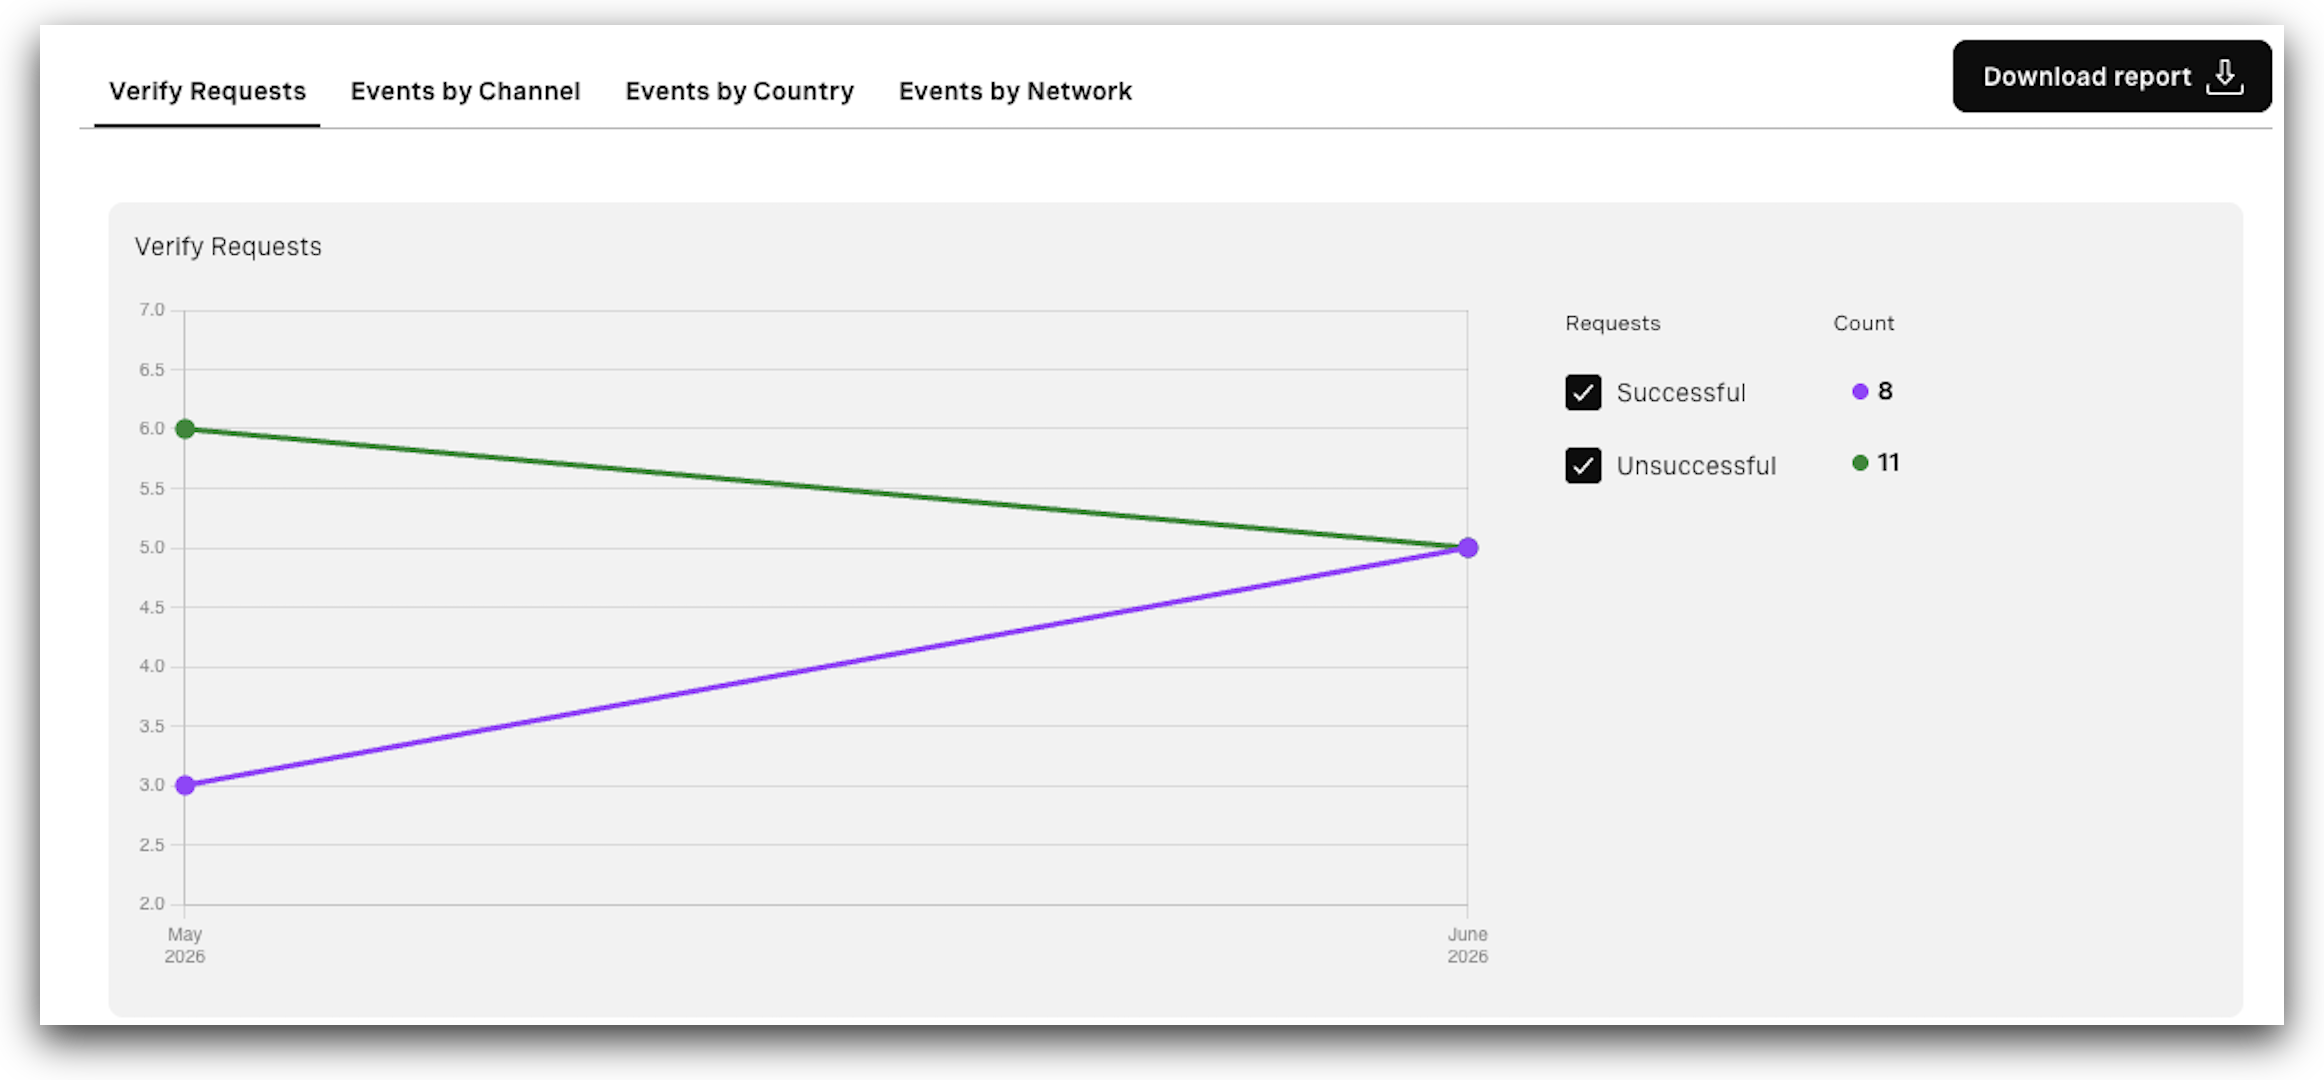
The graph presents metrics:
- Successful - Count of converted (successful) requests. You can toggle them on or off.
- Unsuccessful - Count of requests other than successful (failed, expired, rejected, user_rejected, canceled, blocked). You can toggle them on or off.
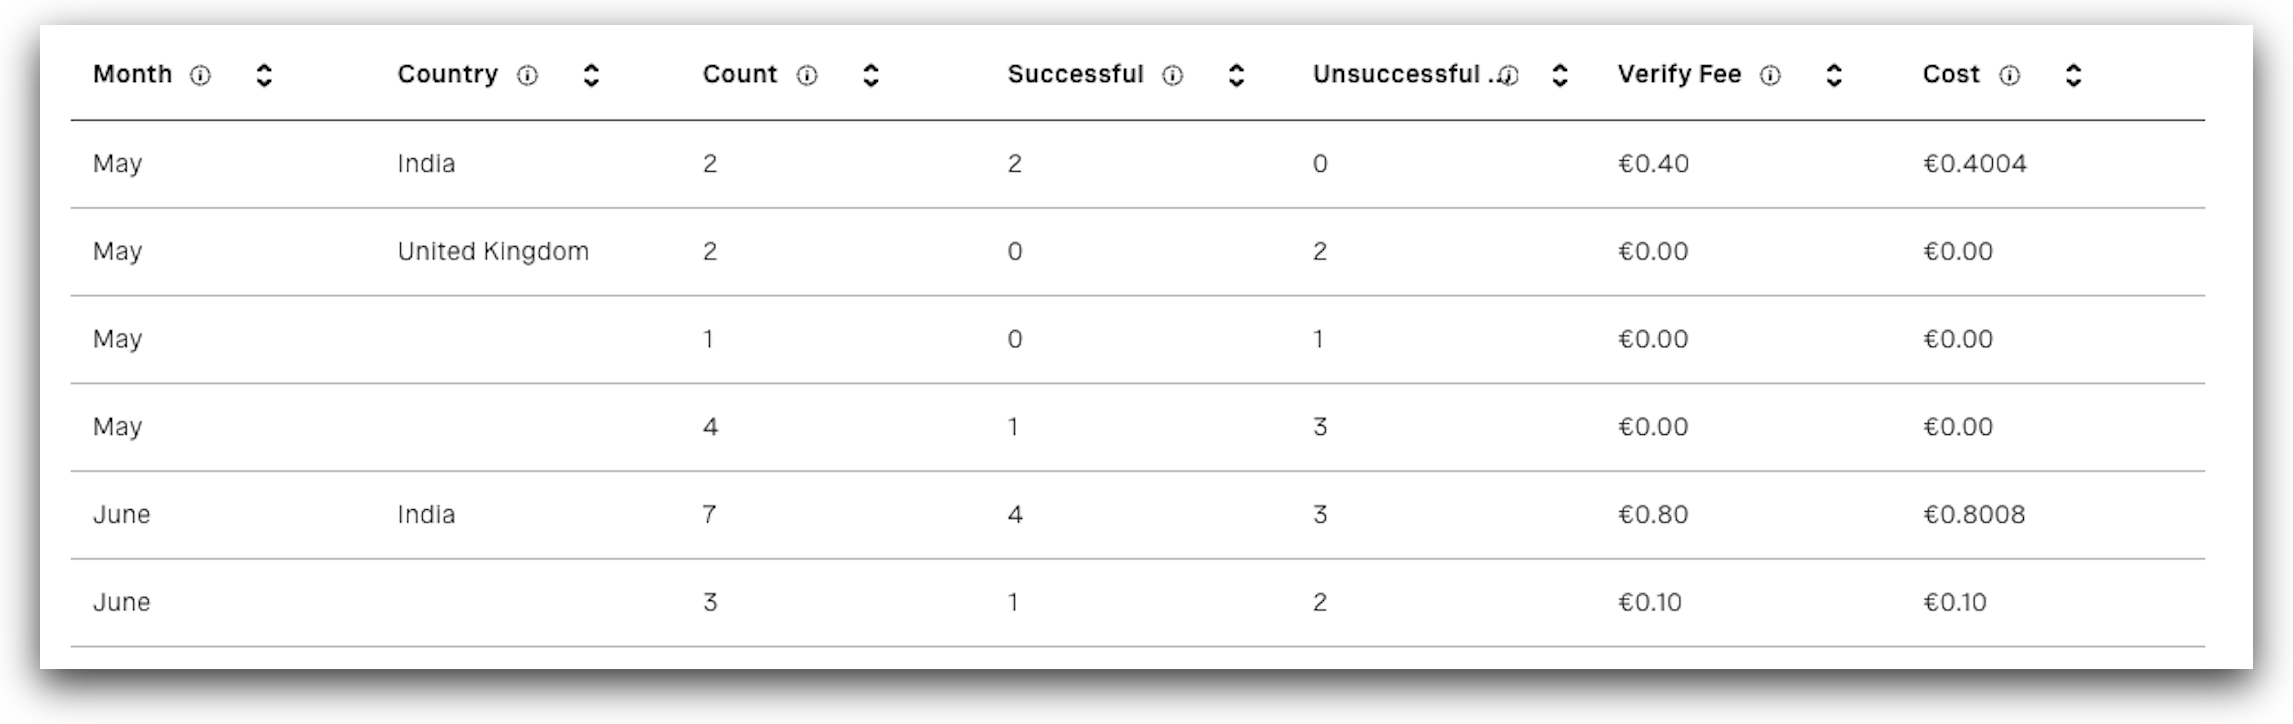
Beneath the graph, the table presents the request data broken down by months or weeks, depending on the filter selected. The table includes:
- Month - The month in which the request(s) were made.
- Country - Country for which requests were made.
- Count - Number of requests made during that period.
- Successful - Number of converted (successful) requests.
- Unsuccessful - Number of requests other than successful (failed, expired, rejected, user_rejected, canceled, blocked).
- Verify fee - Verify platform fee only.
- Cost - Verify platform fee plus the channel fee, depending on which channel(s) are used. For customers on Success pricing, the Total cost equals the Verify fee since no channel fee is charged. For customers not paying the Verify fee, the Total cost equals only the channel fee.
Channel Events Tab
The Events by Channel tab allows you to see how many requests were made for each supported channel.
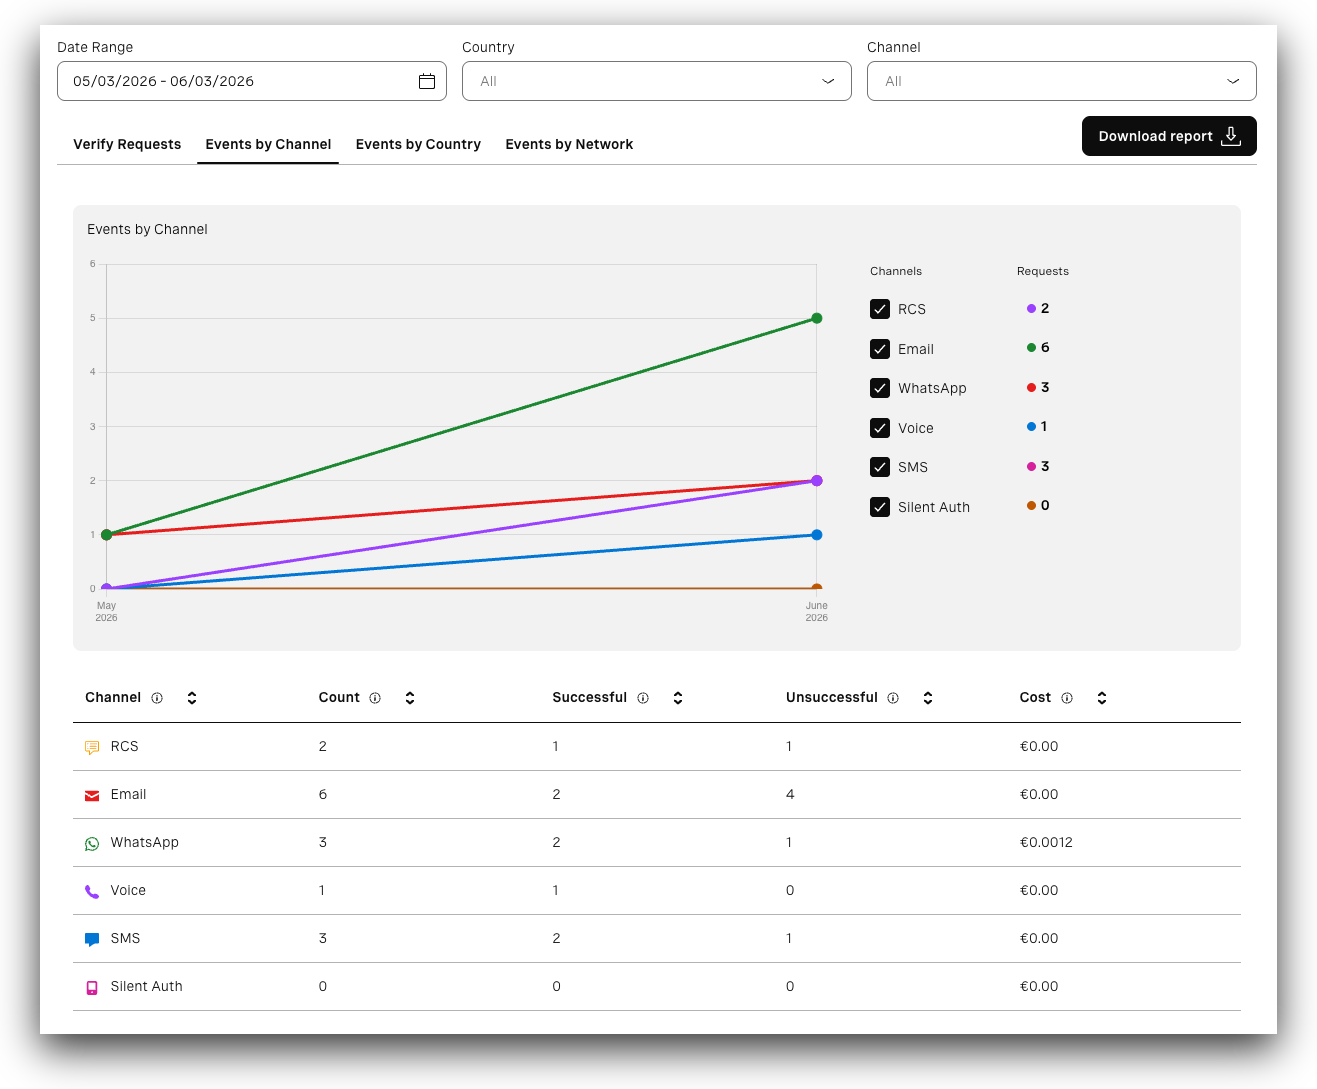
The graph represents the metrics and allows you to control what data is displayed:
- Channels - Specifies the channels. You can toggle specific channels on or off.
- Requests - Specifies how many requests were made per channel.
Beneath the graph, the table presents a breakdown by channel. It includes:
- Channel - Specifies the channel.
- Count - Number of requests made for a specific channel.
- Successful - Number of converted (successful) requests.
- Unsuccessful - Number of requests other than successful (failed, expired, rejected, user_rejected, canceled, blocked).
- Cost - Verify platform fee plus the channel fee, depending on which channel(s) are used. For customers on Success pricing, the Total cost equals the Verify fee since no channel fee is charged. For customers not paying the Verify fee, the Total cost equals only the channel fee.
Events by Country
The Events by Country tab allows you to see how many requests were made per country.
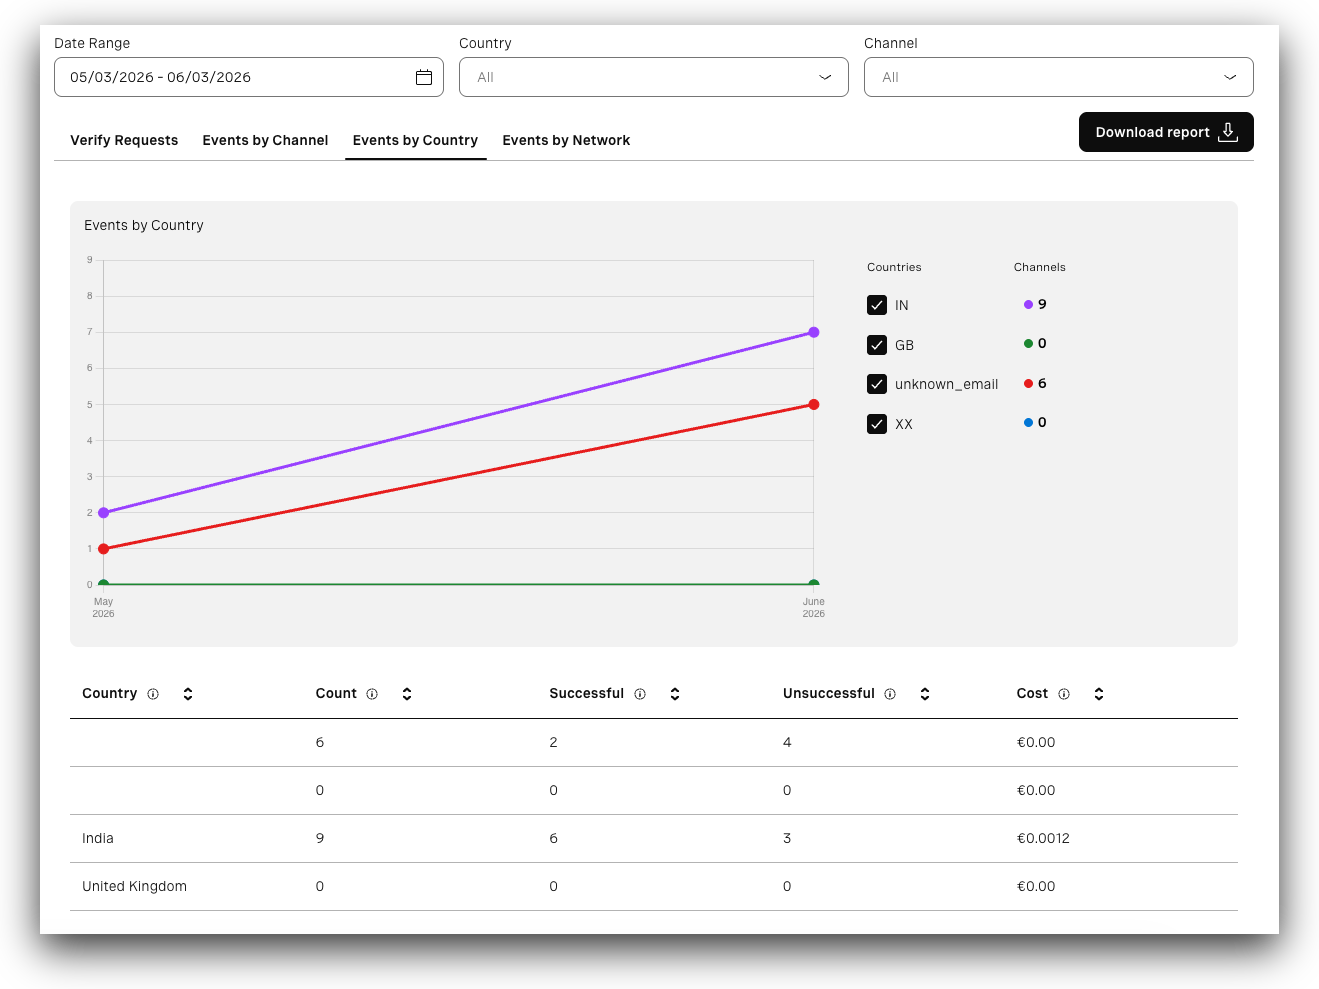
The graph represents the metrics and allows you to control what data is displayed:
- Countries - Specifies the countries. You can toggle specific countries on or off.
- Channels - Specifies how many requests were made per country.
The unknown_email indicates Email country usage, which lacks an associated country.
Beneath the graph, the table presents a breakdown by country. It includes:
- Country - Country for which requests were made.
- Count - Number of requests made for a specific country.
- Successful - Number of converted (successful) requests.
- Unsuccessful - Number of requests other than successful (failed, expired, rejected, user_rejected, canceled, blocked).
- Cost - Verify platform fee plus the channel fee, depending on which channel(s) are used. For customers on Success pricing, the Total cost equals the Verify fee since no channel fee is charged. For customers not paying the Verify fee, the Total cost equals only the channel fee.
Events by Network
The Events by Network tab allows you to see how many requests were made per each network.
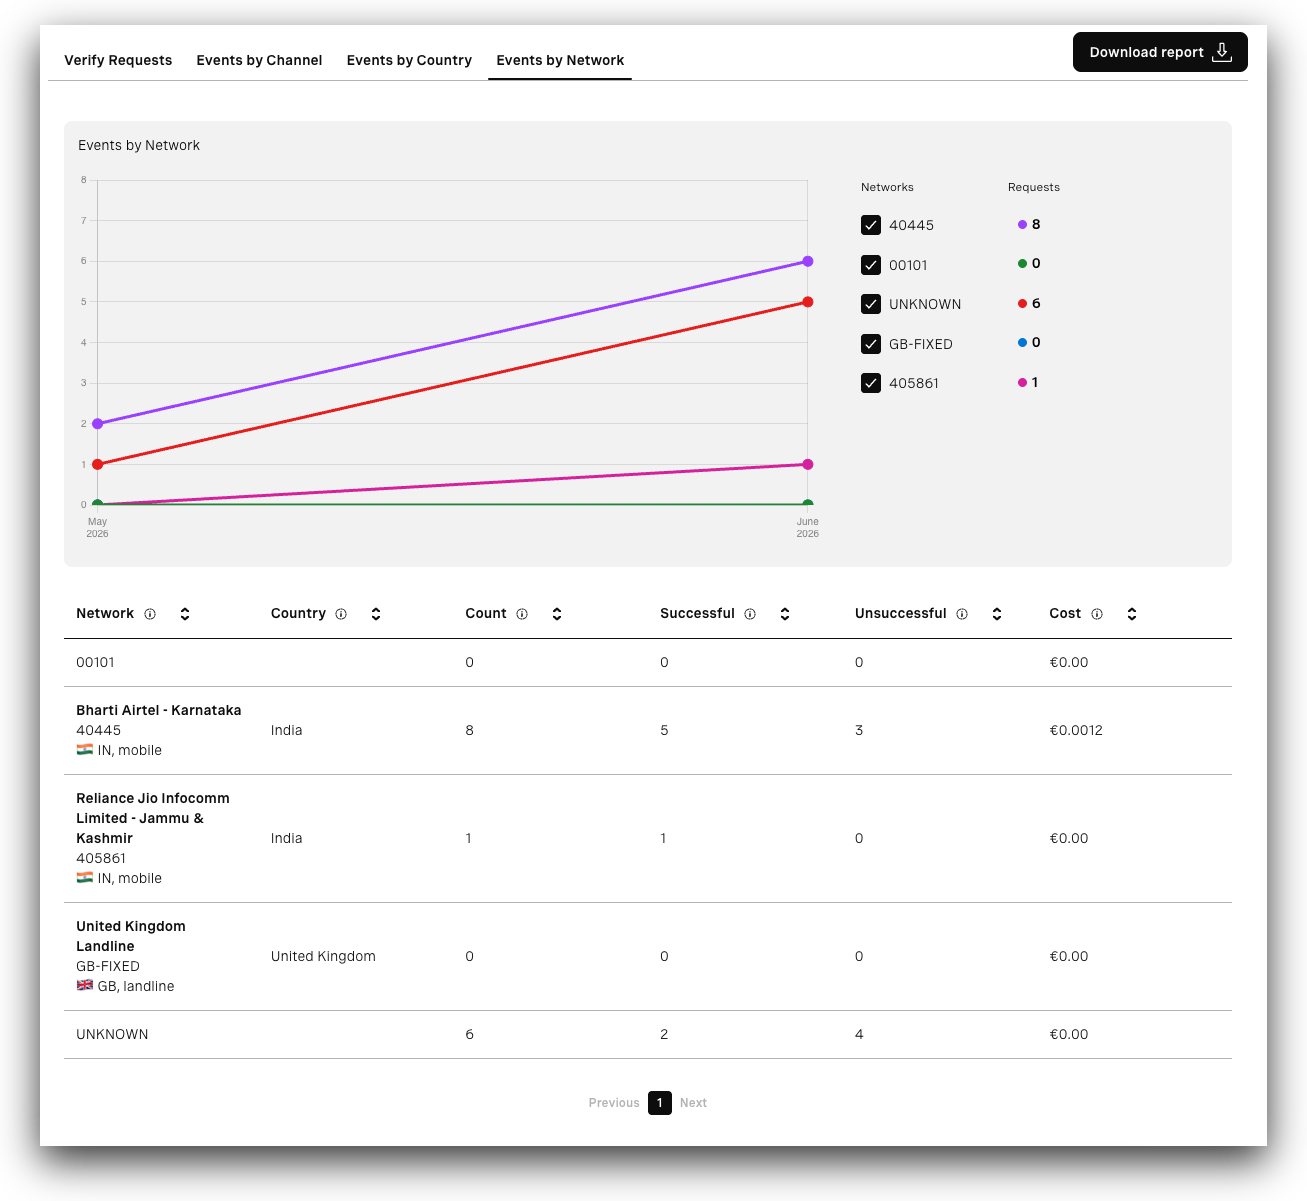
The graph represents the metrics and allows you to control what data is displayed:
- Networks - Specifies the networks. You can toggle specific networks on or off.
- Requests - Specifies how many requests were made per network.
The UNKNOWN indicates Email country usage, which lacks an associated country.
Beneath the graph, the table presents a breakdown by network. It includes:
- Network - Network for which requests were made.
- Country - Country for which requests were made.
- Count - Number of requests made for a specific network.
- Successful - Number of converted (successful) requests.
- Unsuccessful - Number of requests other than successful (failed, expired, rejected, user_rejected, canceled, blocked).
- Cost - Verify platform fee plus the channel fee, depending on which channel(s) are used. For customers on Success pricing, the Total cost equals the Verify fee since no channel fee is charged. For customers not paying the Verify fee, the Total cost equals only the channel fee.